Yes!! ![]()
Hi, I came from Godot 4.2 C# + Visual Studio 2022 (with debug), but I just needed to test a C# project in Godot 3.5.3 Mono for a web export test, and I was having the same issue related to the debugger in Visual Studio 2022. I installed the Godot C# extension for Visual Studio in the hope that I could debug with it, but nothing happened when I tried to debug or attach manually. I researched and tried several approaches in VS 2022 without success. Even enabling the debugger agent (Project Settings > General > Mono > Debugger Agent > Wait for Debugger : ON) and increasing the wait time to 15000 (Project Settings > General > Mono > Debugger Agent > Wait Timeout : 15000).
Then I went to VS Code to see if I could get debugging to work there using the extensions for “C# for Visual Studio Code (Microsoft)”, “C# Tools for Godot (Ignacio Roldán Etcheverry)”, and “Mono Debug (Microsoft)”. And I noticed that after creating the launch.json (in the “Run and Debug” tab) there was this Mono option in the file to attach to the debugger:
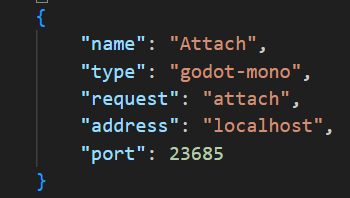
So to test it, with the Godot editor open, I started the Godot project and in VS Code I ran the “Attach” option and the breakpoint was hit!
Since I never give up trying everything possible, I went back to Visual Studio 2022 and looked for a way to use the same approach and found this extension:
I installed it and in the “Settings…” (Extensions > Settings…) I configured the same port as used by Godot:

Then I started the Godot project, the application went into “waiting” mode, and I selected the option to attach to mono in VS 2022 (Extensions > Attach to mono debugger ) …and voilà! A breakpoint was hit! ![]()
Let me know if it helps you too! ![]()
Kind regards,
Victor