Godot Version
4.7.2
Question
I’m looking around documentations and can’t find details if is possible to check core counts for CPU and GPU from Godot, best if it checks clock speeds.
Something useful was using Performance — Godot Engine (4.7) documentation in English which can be used for static memory
	Performance.get_monitor(Performance.MEMORY_STATIC)
	Performance.get_monitor(Performance.MEMORY_STATIC_MAX)
edit found the cpu count under OS
in case of Nvidia usually CUDA cores,
in case of Apple they call it simply GPU cores
but overall it’s processing units
What would you do with that information?
Check unknown hardware for the specs from sandbox to roughly know what’s equivalent it is, so can expectations instead of guessing.
In case of memory I know where I am standing at but this core performance is a unknown.
Afaik, even operating systems cannot pluck that information out of gpu drivers.
The best you can do from Godot is to get the gpu model and look up what’s declared by the manufacturer in some online database, or run an external utility that does so.
RenderingServer.get_video_adapter_name()
RenderingServer.get_video_adapter_type()
RenderingServer.get_video_adapter_vendor()
Using the O.S. Singleton, try OS.get_processor_count() and OS.get_processor_name().
As for GPU info, there’s OS.get_adapter_info(), but as the documentation itself says, it only shows gpu driver name and version, and only on linux and windows.
You can do more thorough introspection using the operating system’s own command line through OS.execute() but beware, there be dragons. Your hardware info script will have to deal differently with each brand, which means different commands for GCN3, RDNA2, Turing, Blackwell, PowerVR Rogue, Mali Midgard, Mali Bifrost, Intel Xe, Adreno 5xx, Adreno 7xx so on and so forth.
If you want to guess graphics quality settings for your game, it might be more straightforward to build some tiny stress-test scenes with heavy shaders or expensive simulations and run them in order from low to mid to high-quality. Stress test on first load, detect whatever preset dips under 60fps, pick one level below and forget the rest (they might just straight up freeze or crash the game from running out of memory)
Good idea, I’ll try some stress test to see what’s it is capable of .
In terms of memory i noticed big headroom, CPU/GPU how to stress test the cores to see results?
Figuring out the “strength” of the hardware you’re running on is always problematic and just not worth the effort. It’s generally a waste of time. Instead, provide typical quality scaling options for the player and let them adjust to run acceptably on their platform.
so for context i run now simple 2d game where new mobs are spawned with 800+mobs it start drop from steady 60fps to 43fps and below, with around 1100 mobs spawned, fps are down to 5-6fps.
memory from gpu reported - 230mb used
draws=1301 objects=2092 prims=4268 tex=12 MB buf=8 MB vram=31 M
the cpu core count shown as 8.
the game I tested was - Your first 2D game with Godot 4 | GDQuest Library
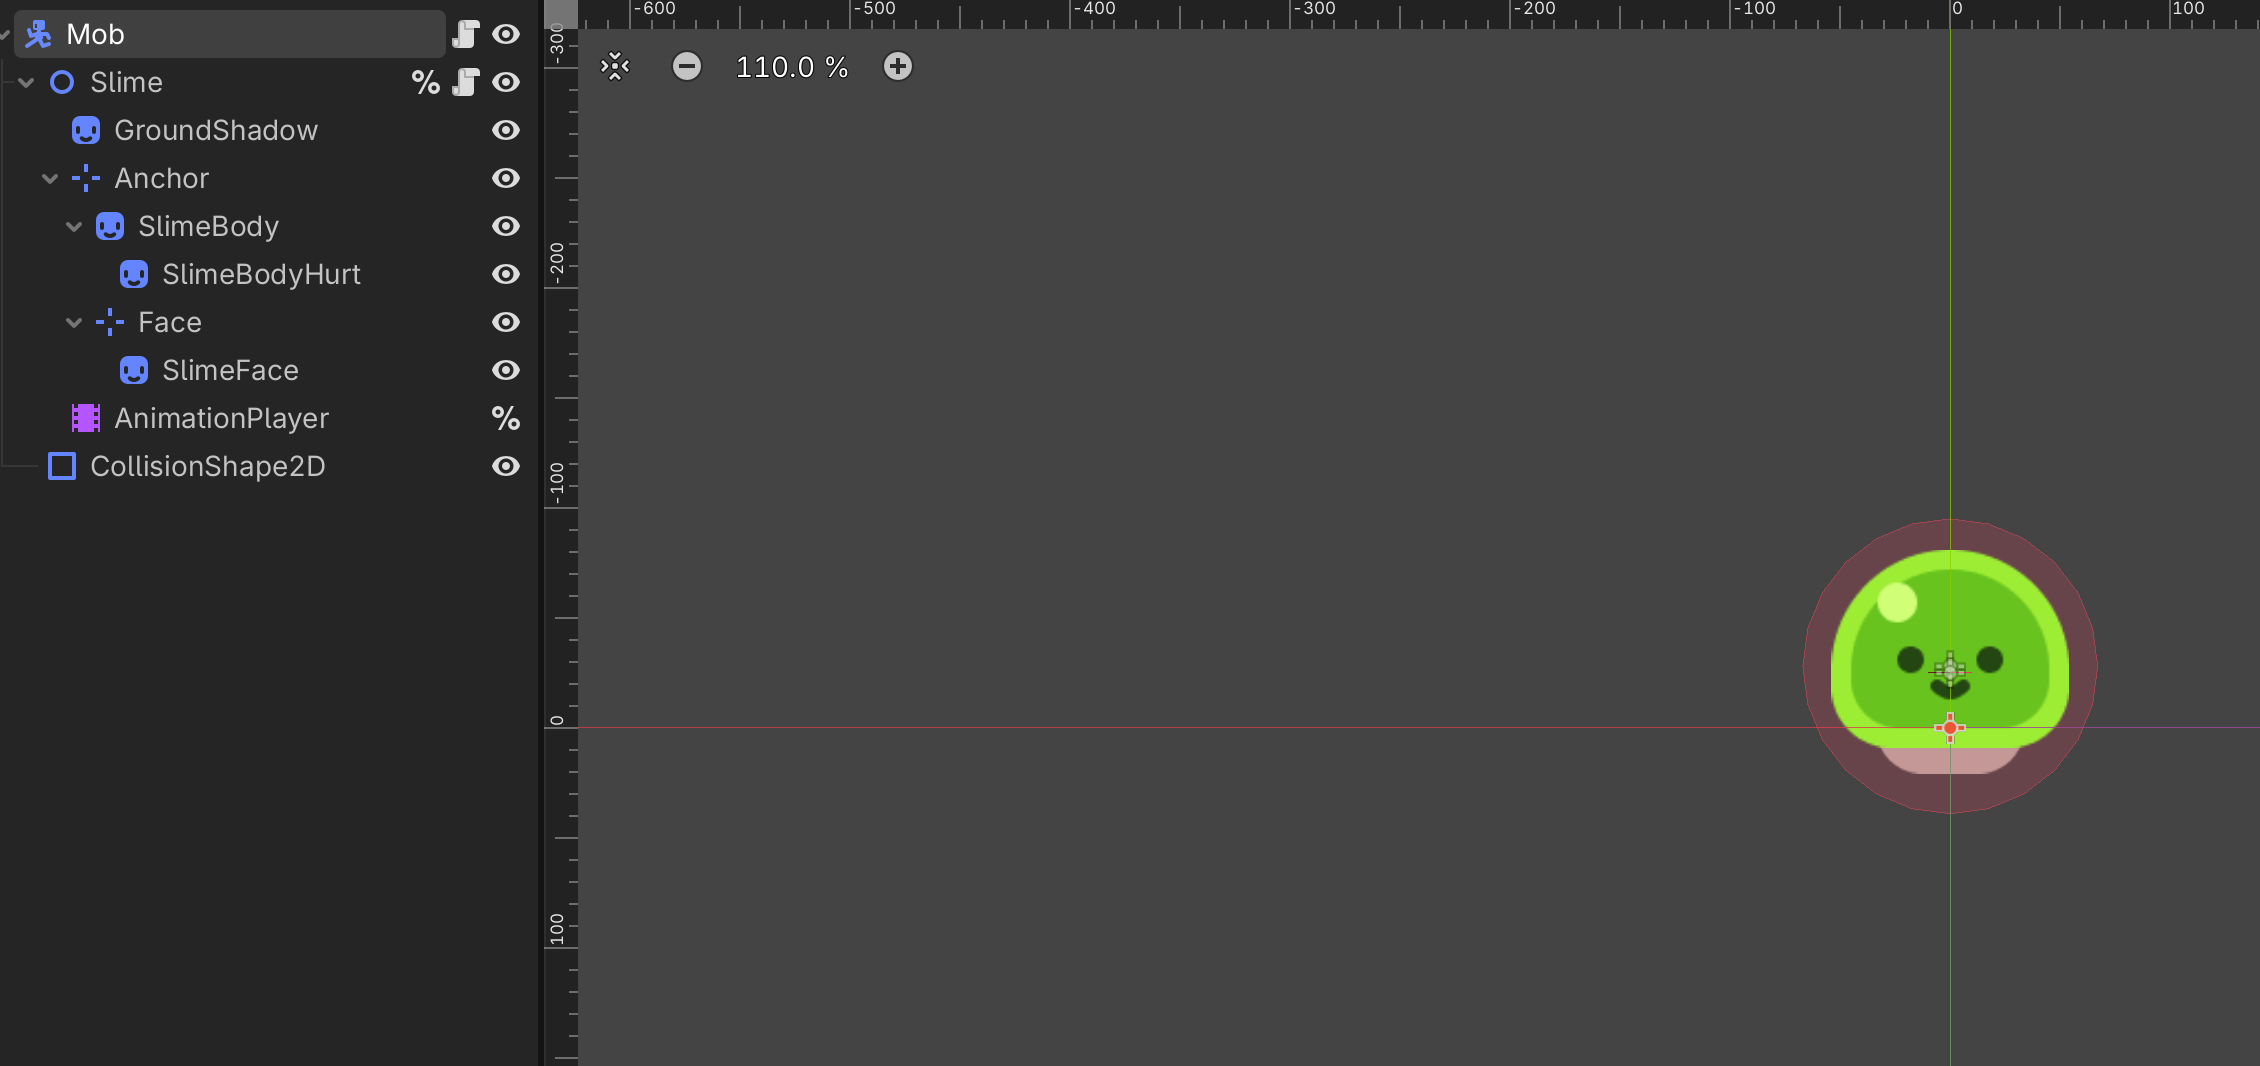
mob is this simple scene, most of resources are probably taken by AnimationPlayer, which cycles between three simple animations which scales and changing position of sprite.
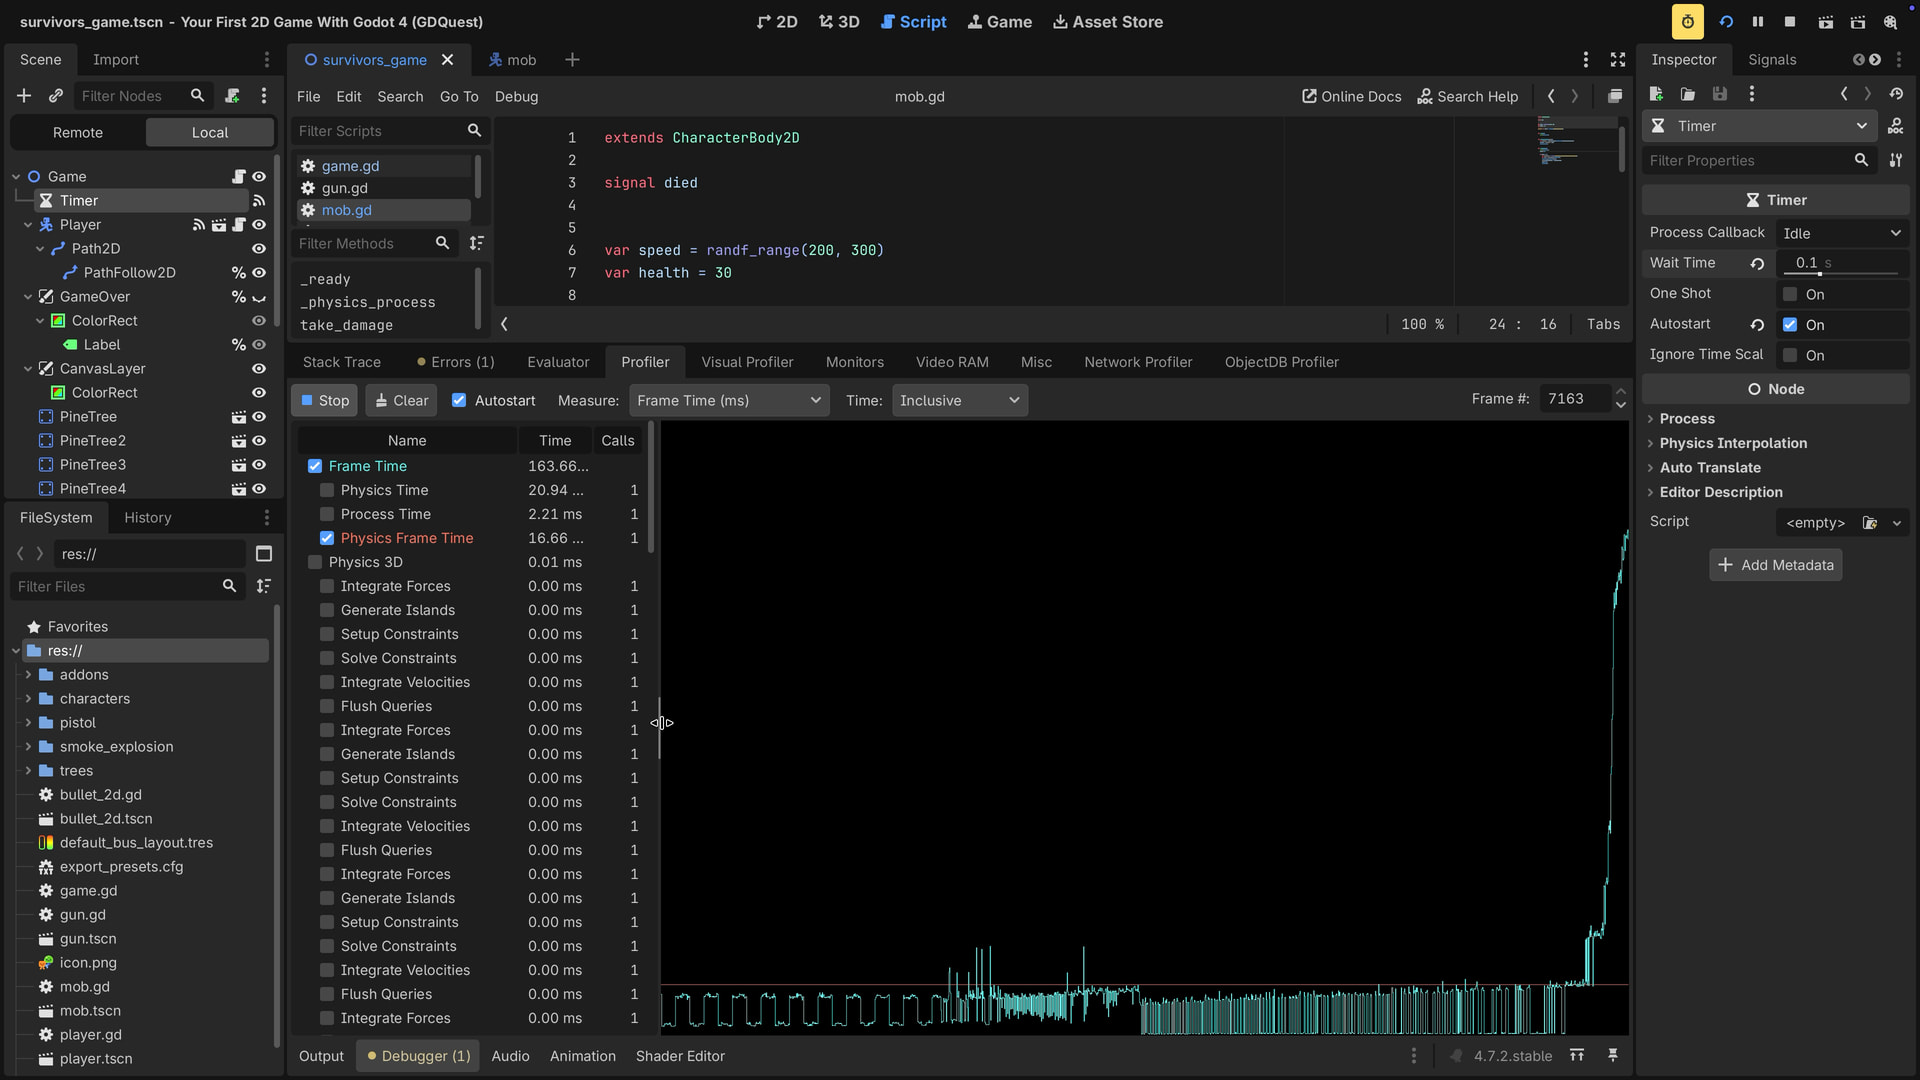
What does the profiler say? Where is the frame time spent?
At that scale you need special optimization.
@FrozenFried
Yes sure thing, but I tried to use it as “benchmark”.
This post tackled it Thousands of 2D enemies in plain GDScript: flat arrays, a counting-sort grid and MultiMesh not sure if is AI or not.
@normalized
I can’t find much details how to deploy profiler via network, as game is executed with different program which load from .pck the data into cache folders.
Natively in editor it easy but it be different hardware if I include debugger in pck would I be able to get any of those data on local network?
I thought cpu-z but it’s rather for serious devs CPUID DEVELOPERS CORNER
You mean on device which have editor or write some custom code to tracks id enemy and time inside executed process?
# Measuring the time it takes for worker_function() to run
var start = Time.get_ticks_usec()
worker_function()
var end = Time.get_ticks_usec()
var worker_time = (end-start)/1000000.0

# Measuring the time spent running a calculation over each element of an array
start = Time.get_ticks_usec()
for calc in calculations:
	result = pow(2, calc.power) * calc.product
end = Time.get_ticks_usec()
var loop_time = (end-start)/1000000.0

print("Worker time: %s\nLoop time: %s" % [worker_time, loop_time])
Run it from editor, profile, and determine bottlenecks.
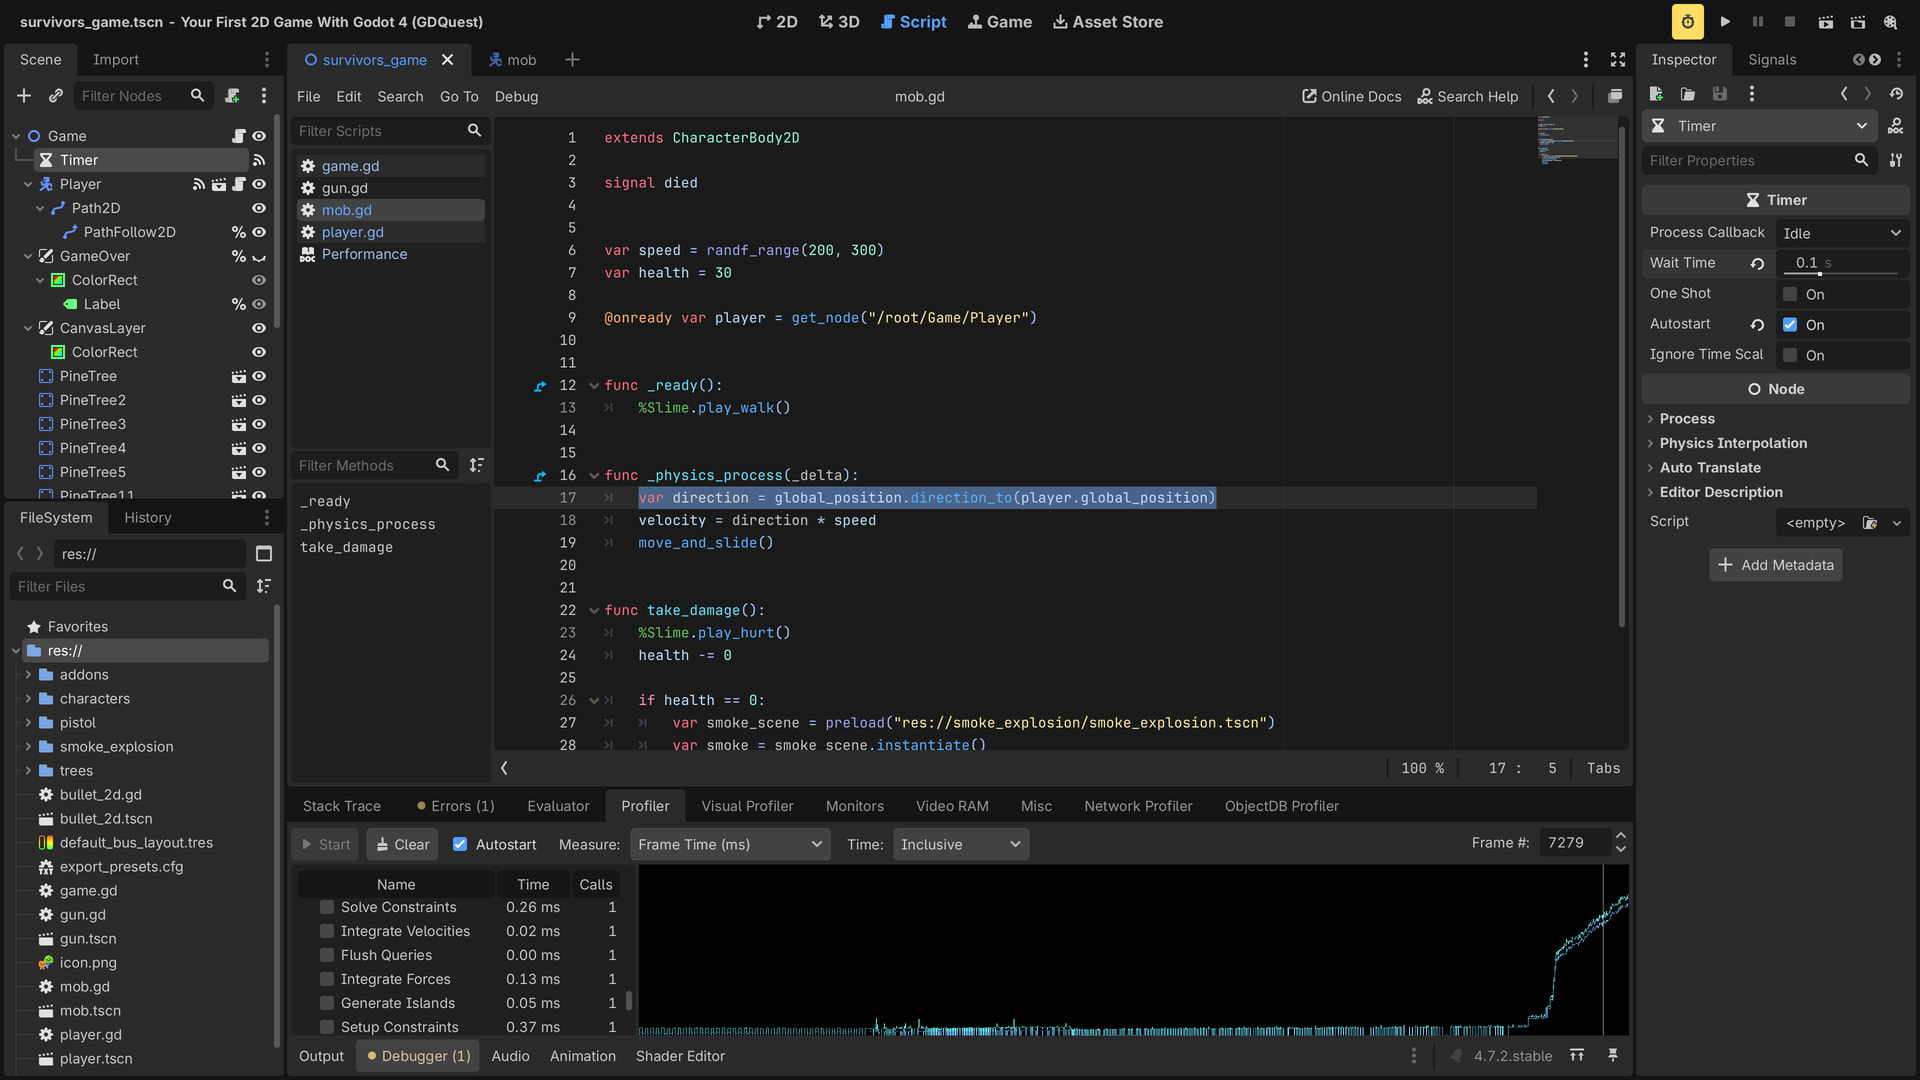
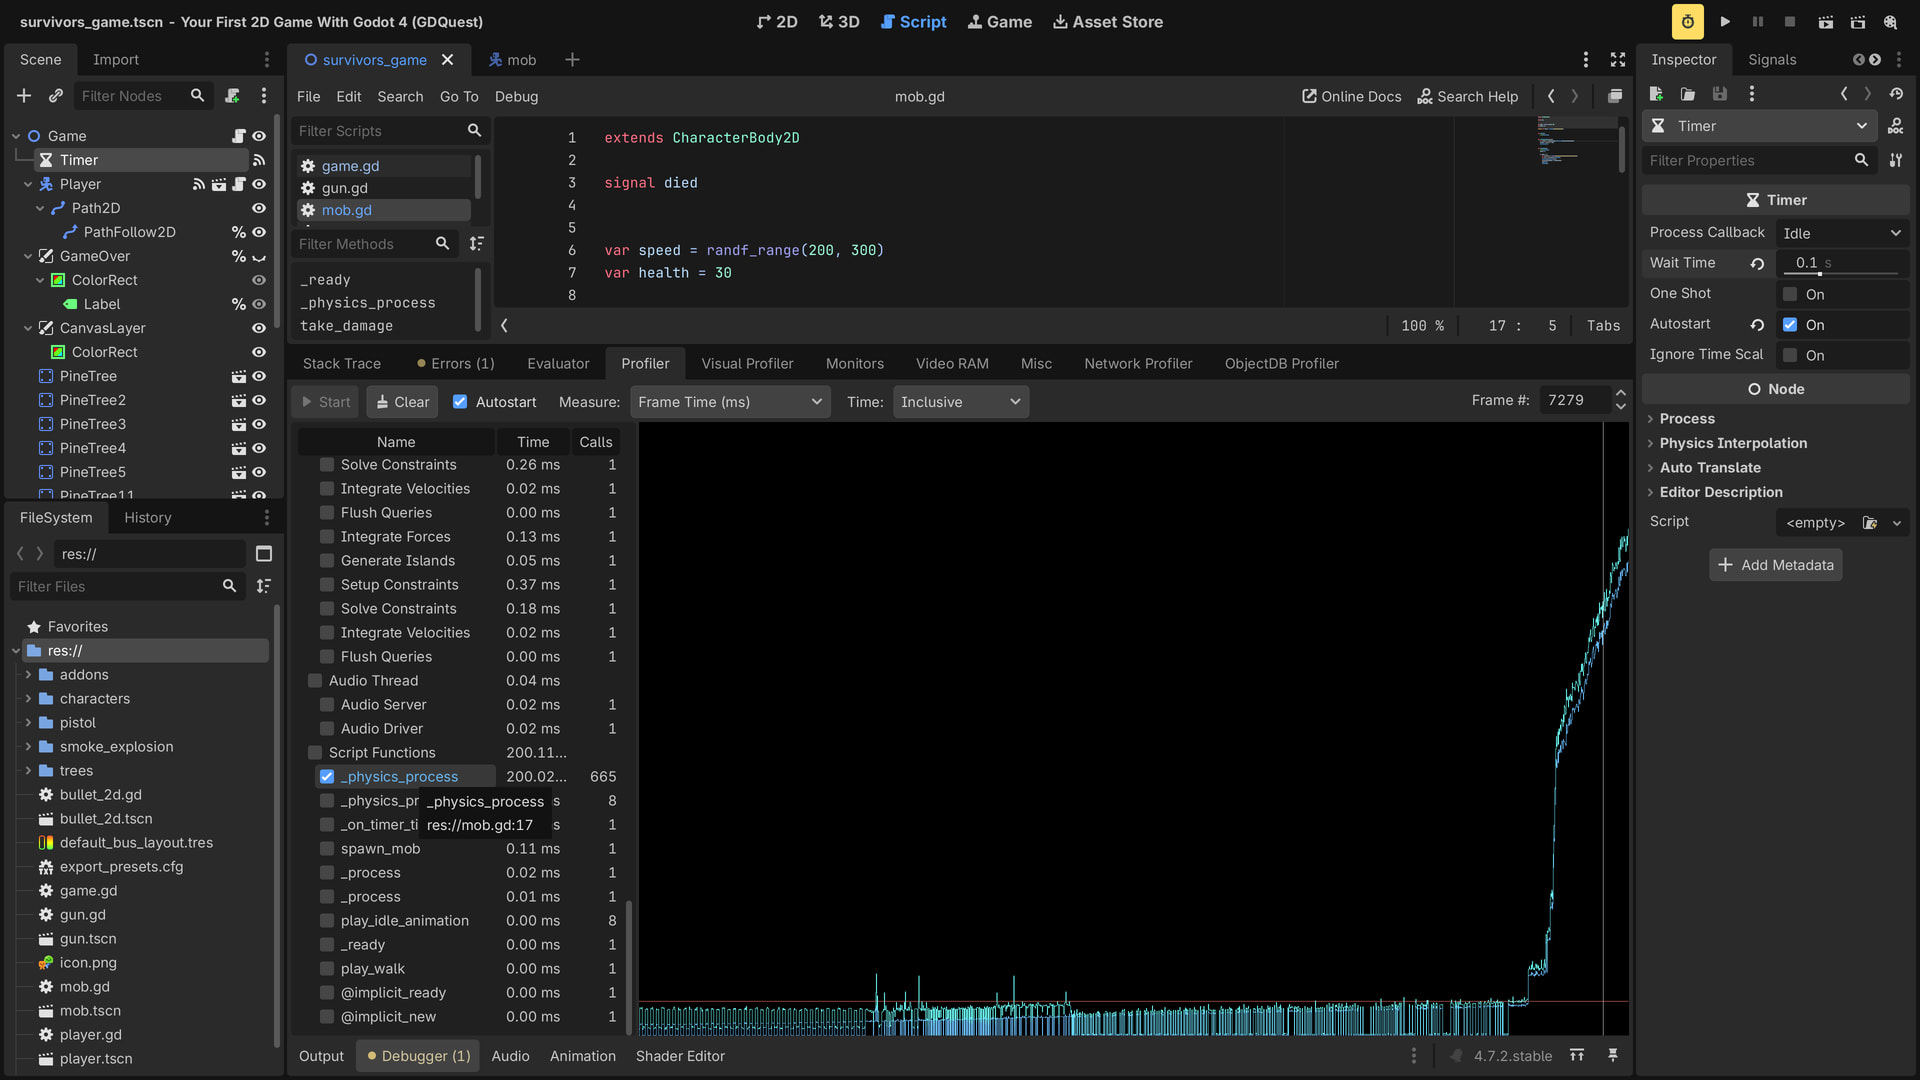
According the profiler the most delayed is physics_process line 17 which determines direction to player, but next is called move_and_slide().