Godot Version
4.2 (on MacOS)
Question
I’ve got the problem that my builds (doesn’t matter whether built from editor or exported) always crash (means “freeze”; spinning ball of death; has to be force closed from task manager) after running for a time, usually around 5 minutes. It does not matter what I’m doing, even just idling in my (as simple as possible) main menu eventually crashes. I tried another very simple project and it too crashes after running fine for some minutes.
Now, being new to Godot, I am at a loss for how to debug this. In Unity, I would run the profiler and hopefully see something building up to the crash, like memory getting bigger and bigger, or some script taking longer and longer. Now, I know Godot has a profiler, too, which unfortunately only works with GdScript, though, and I’m using C#. So I’ve got myself JetBrains Rider and its DotTrace plugin, which is said to be great for profiling but not in my experience, unfortunately. Whatever I do, I only seem to be able to get a single snapshot of a single frame, which is pretty useless in my opinion if I compare this to the continuous timeline of data I get in Unity.
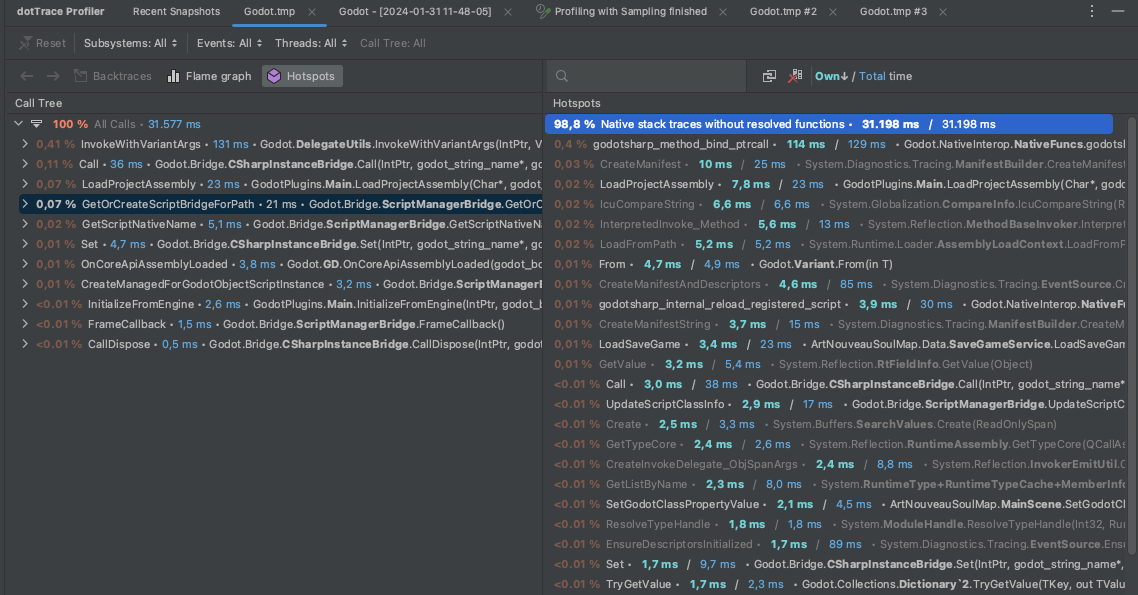
For example, here’s a DotTrace screenshot of a snapshot of my game running. Okay, it tells me about the frame in question having taken 31.577 ms of which 98,8% have been taken up by native Godot stuff, and that’s it. How’s that supposed to be helpful?
Now, my question to you guys & gals is how you would go about debugging this issue?