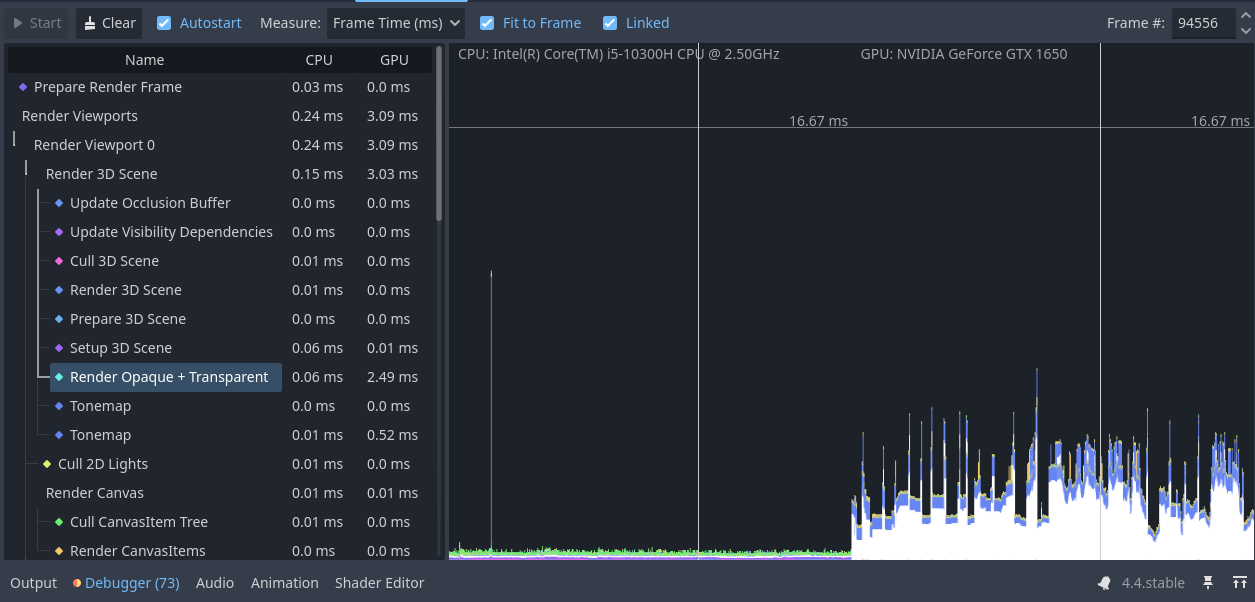
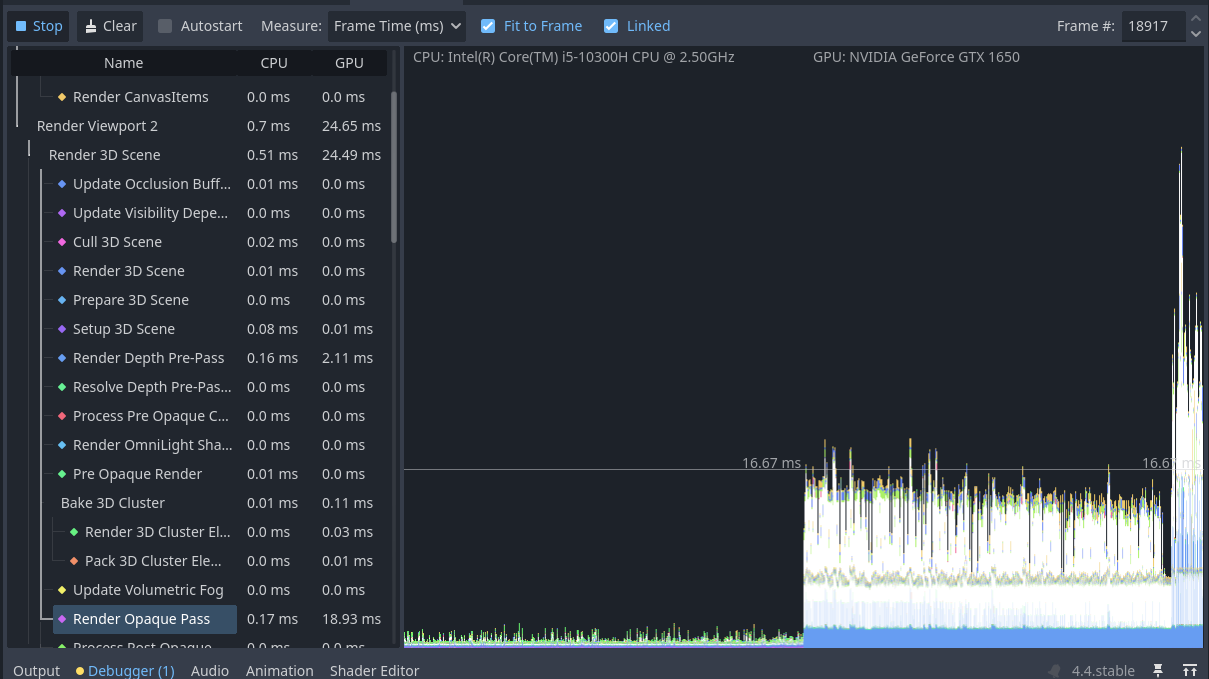
The purple one is Render Opaque Pass and the blue one is Render Depth Pre-Pass. I tried to remove shadows from my flashlight, but I am not sure if it helped.
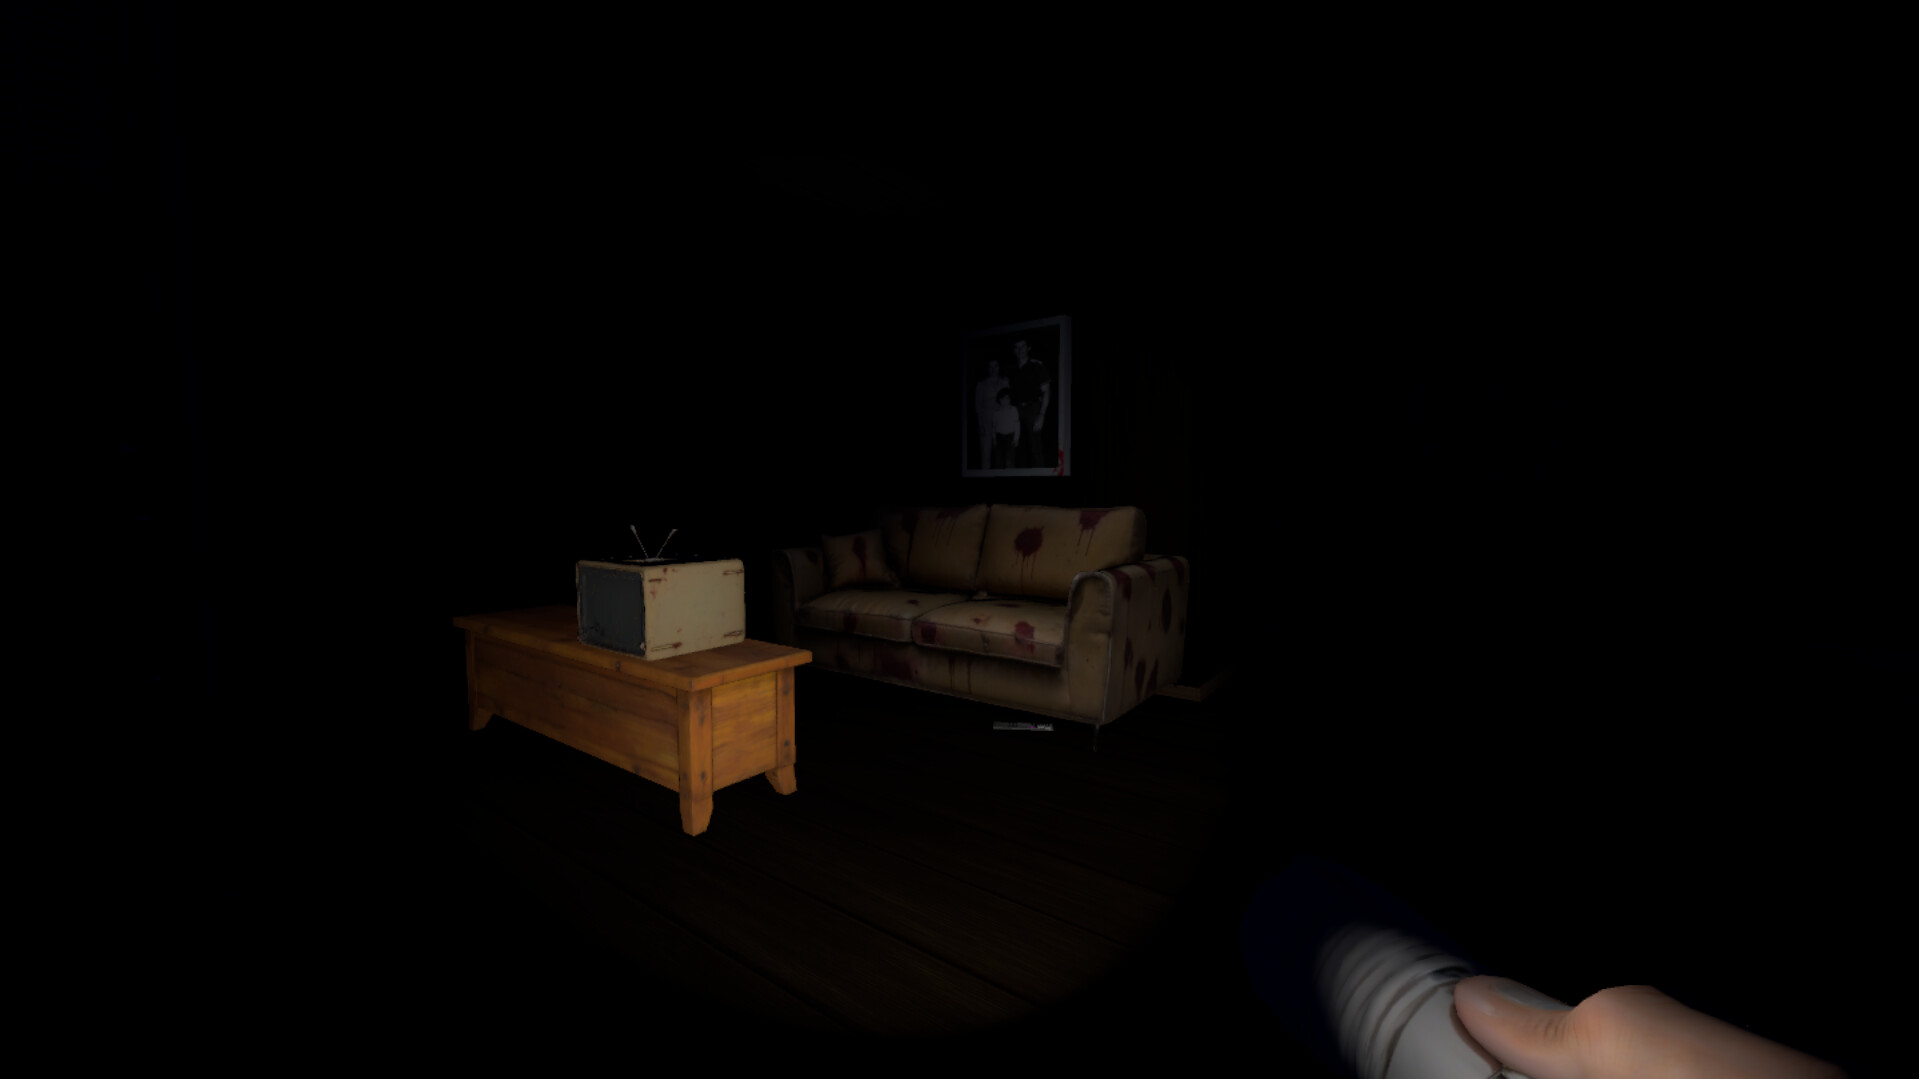
Can we see what are you rendering?
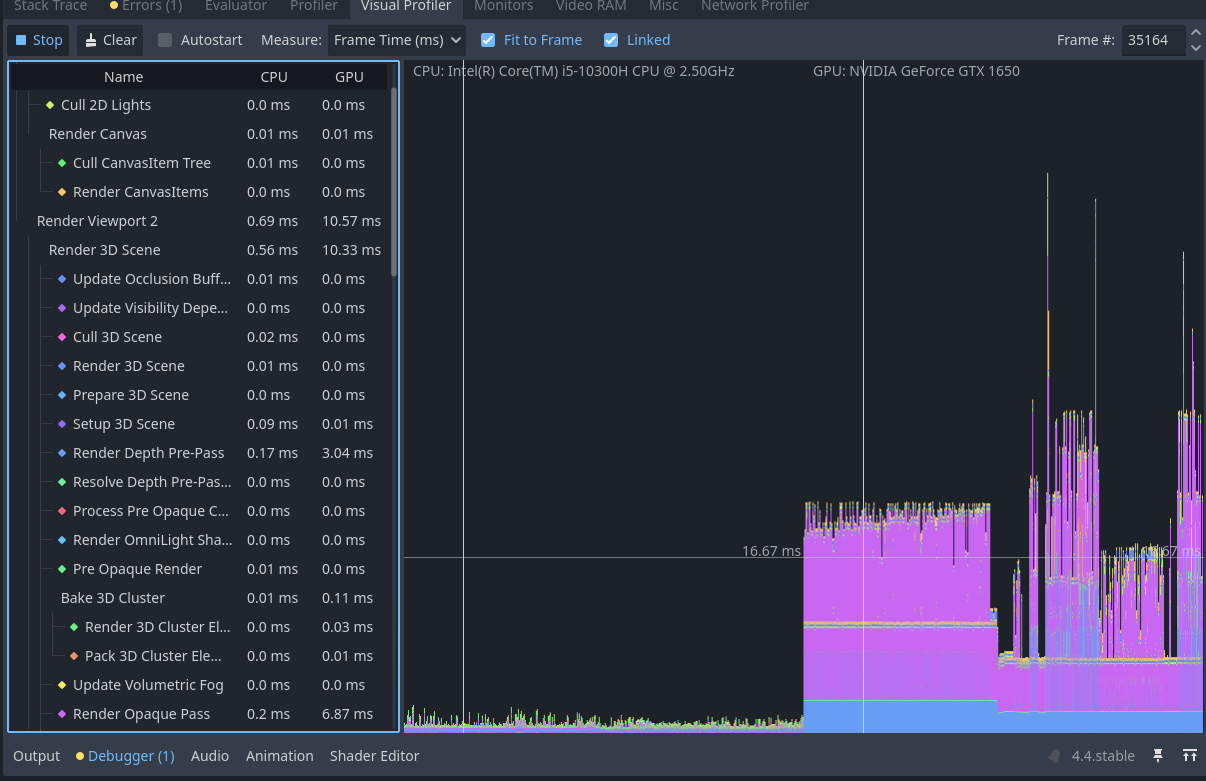
Also I mentioned that I have these insane spikes when I have my game launched and then visit the godot editor just to see how it performs, when I look at the charts, the spikes start to appear as soon as I open the visualizer. When I play the game these spikes don’t seem to occur very often
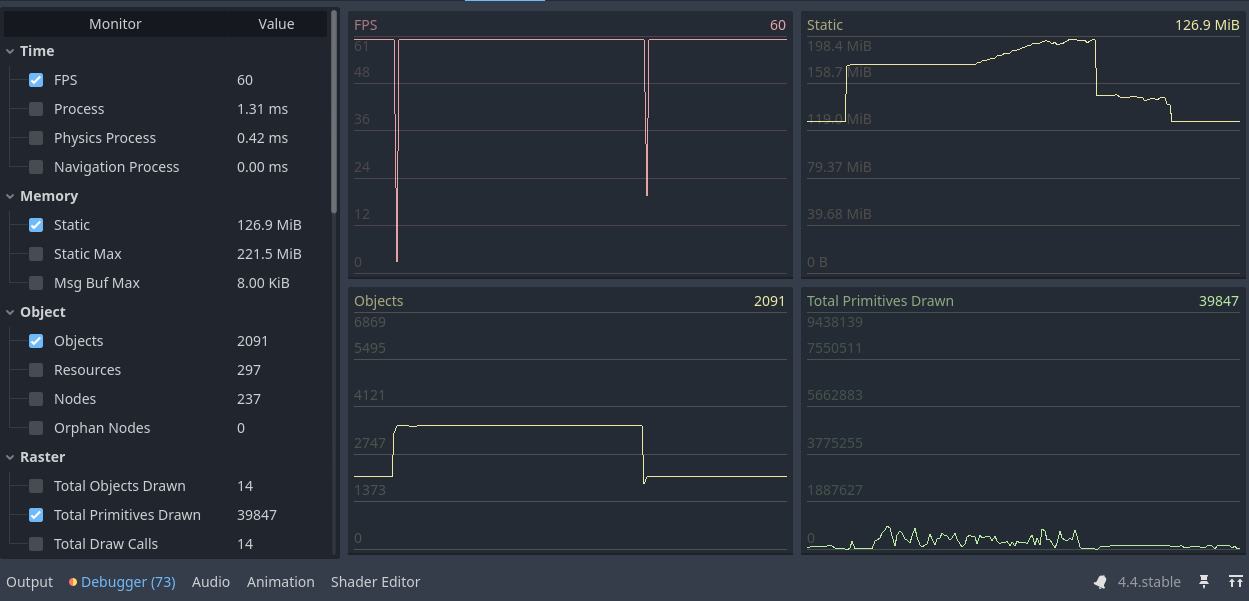
How much stuff are you drawing? Look at monitors/raster.
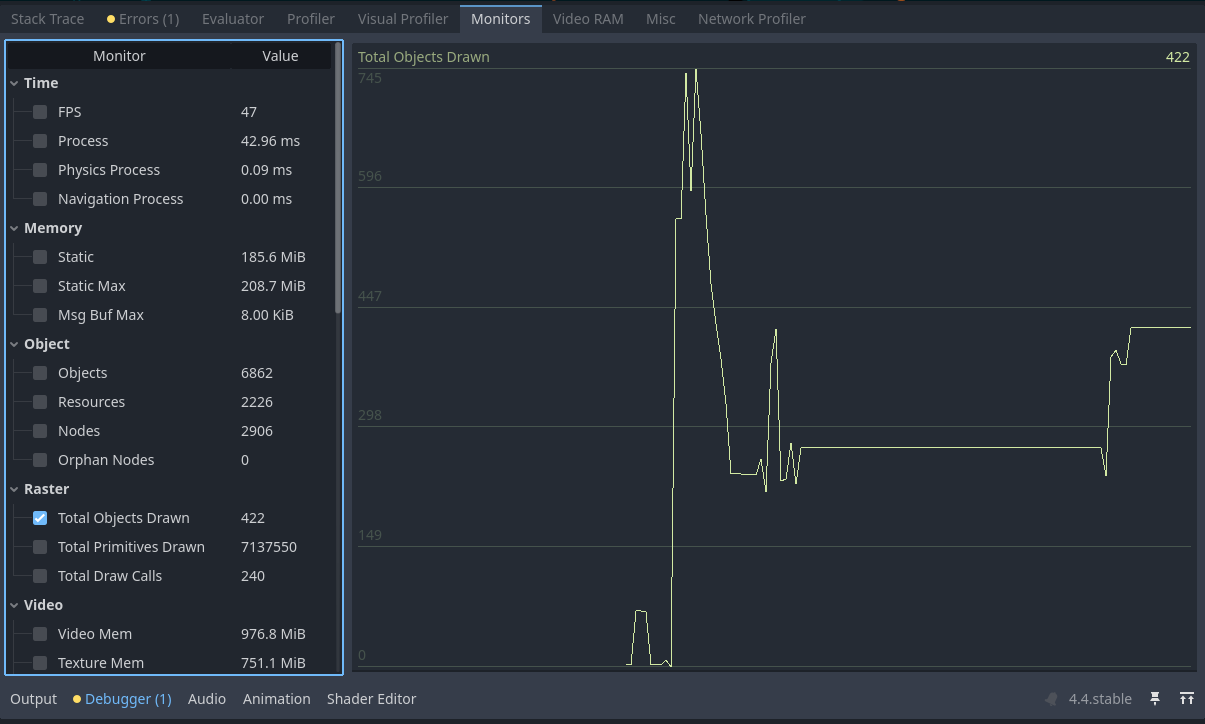
Enable primitives and draw calls as well. Those may be more relevant. Millions of primitives could be a bit much for GTX 1650
1 Like
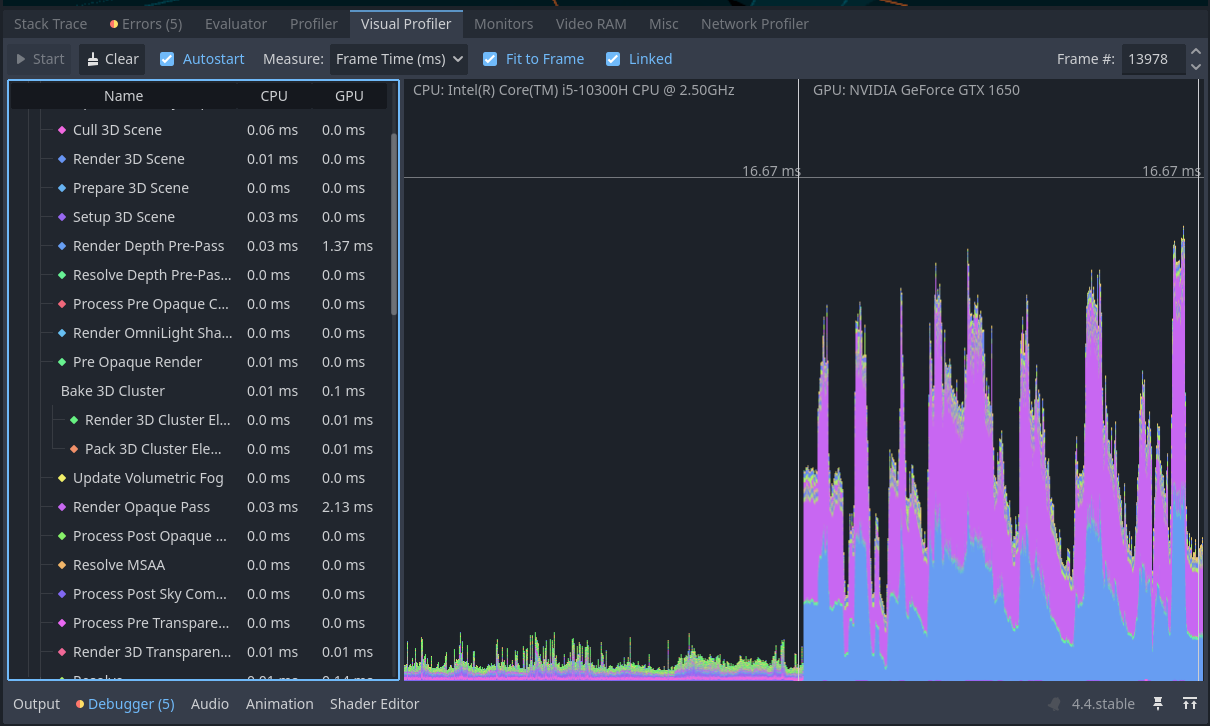
Don’t switch during runtime to the profiler. Just Austostart the profiler, start and play your game, than stop it. It will be recorded and you can check the results after the test.
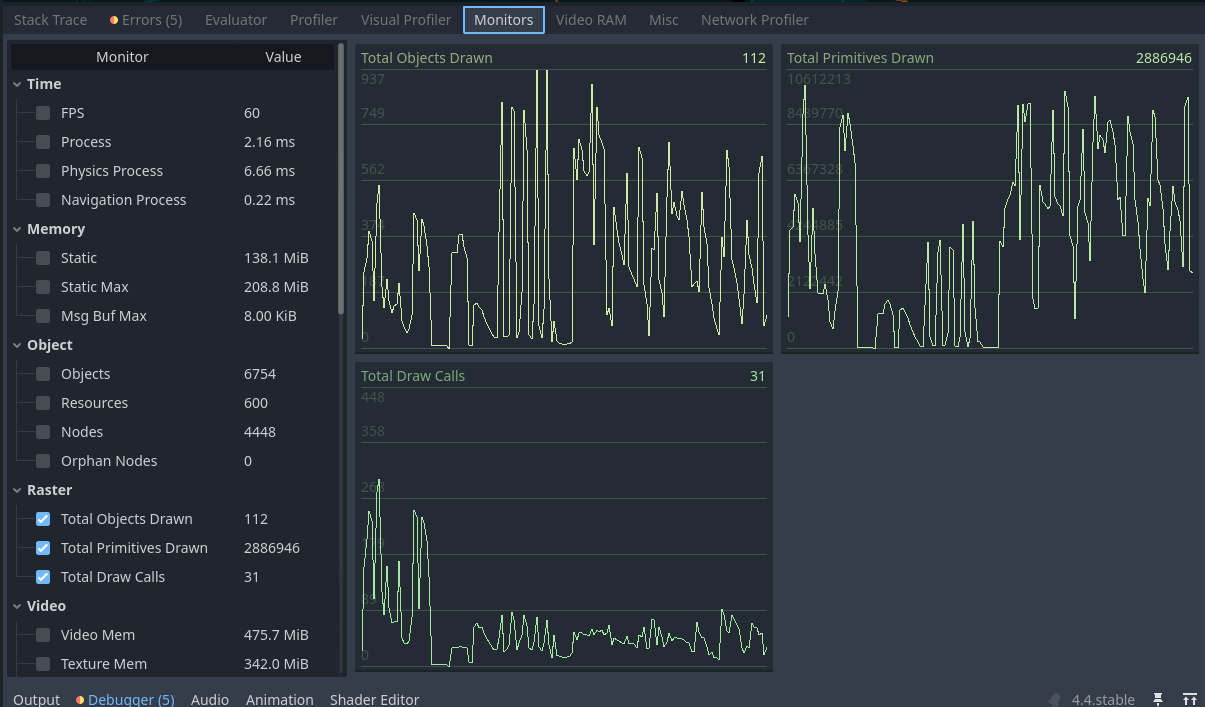
Yeah you’re hitting almost 10 million triangles at occasions. It’s a bit much for this gpu and certainly too much for an integrated card. You’ll have to bring that down if this is your target hardware.
1 Like
Okay, so I should simplify the models that causes these spikes, right? Like less faces and vertices?
1 Like
Yes. But first make sure your meshes are using LOD. Depending on your level design you also may benefit from occlusion culling.
Okay thanks a lot, I’ll come back with updates ![]()
1 Like
Greetings,
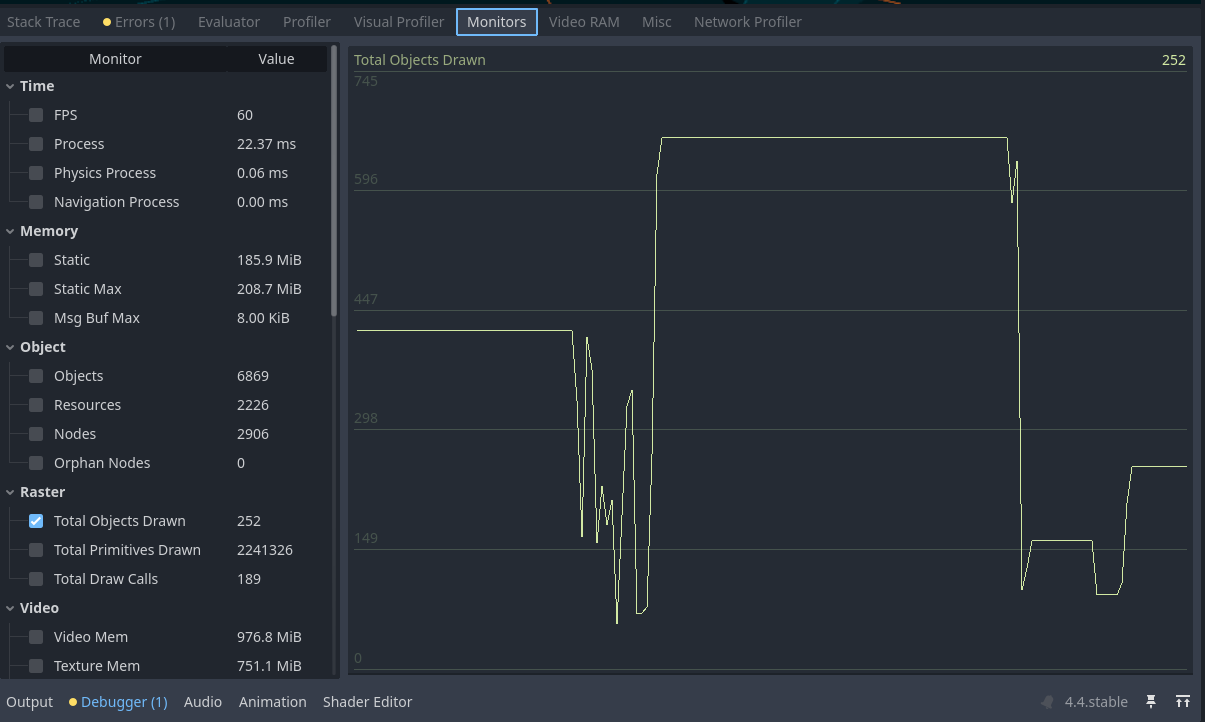
coming back with a short update. I have managed to fix some of the issues related to the game performance and I am pretty sure now it should be better. Feel free to compare the screenshots with the latest ones. I might have missed something but in general it is working quite well to me.
This is the data collected during the whole game session from the very beginning to the last scene.