Greetings, I am experiencing a problem with the performance of my game. On my gaming computer, the game runs without any noticeable lag, but when I run it on another computer, the FPS drops to 30. I checked that the computer I tested the game on after exporting it is not designed for gaming, only for office work, but I don’t think my game is that demanding: it has few complex 3D elements and, overall, the game only takes up 3 gigabytes of memory.
I need to make sure that the game runs without lag on other computers, but after testing it on the test computer, I have my doubts.
How can I be 100% sure that the game will run without lag on most computers? I understand that the game is unlikely to run on very old computers, so I need at least modern ones.
Test computer processor: Inter(R) Core™ i5-8350 CPU @ 1.70GHz(1.90GHz)
System type: 64-bit
Graphics card: Inter(R) UHD Graphics 620
The computer on which the game is being developed:
Is it a stable 30 FPS?
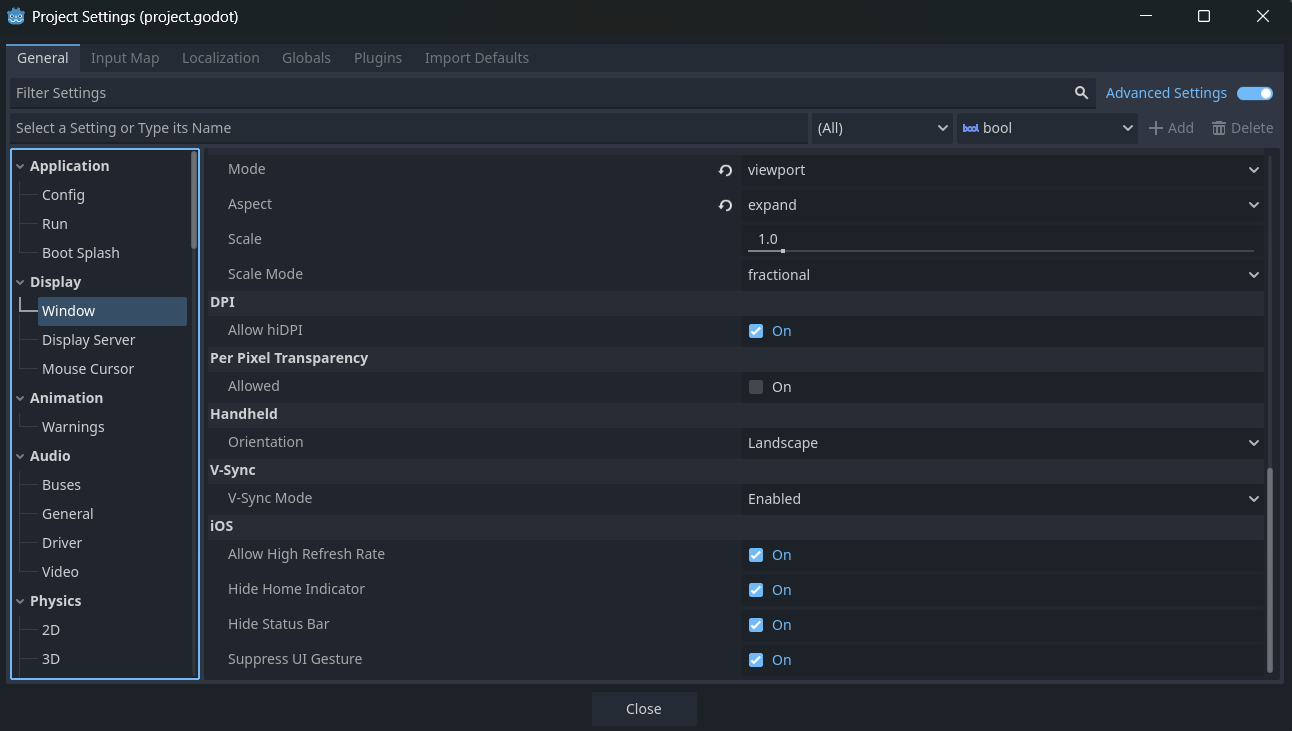
Do you have V-Sync enabled?
V-Sync caps the FPS to the screen’s refresh rate. If the screen has 30Hz, the FPS will be capped at 30 as well.
Yes, nothing really changed when I launch the game on my testing computer. The only thing that runs smoothly is the main menu when you launch the game.
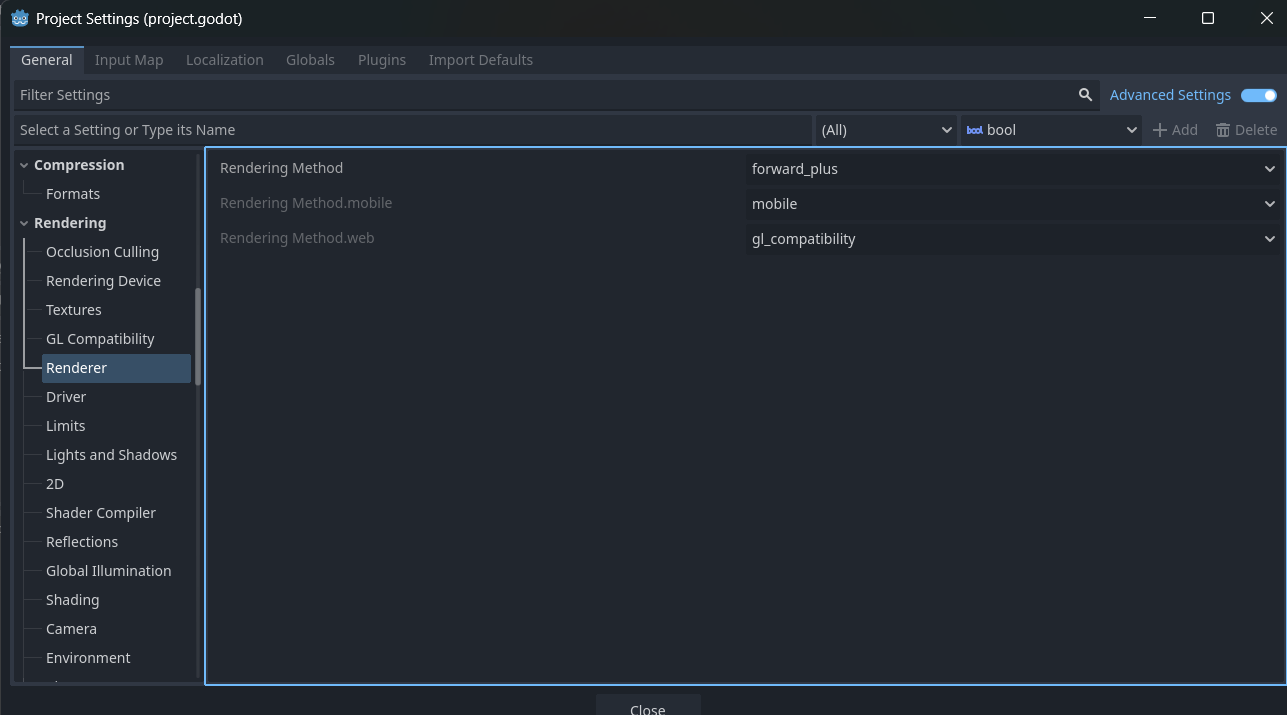
Run the profiler. Your lower-end computer doesn’t have a dedicated graphics card, and your development computer may not either. It could help to use the Compatibility rendering method.
Do you test with the Editor or with builds? If you use builds, are they release or debug builds?
When testing with the Editor, check the Debugger → (Visual) Profiler (set them to autostart) and find the bottleneck. There you can see what will take all the frame time, if it is the scripting or the rendering.
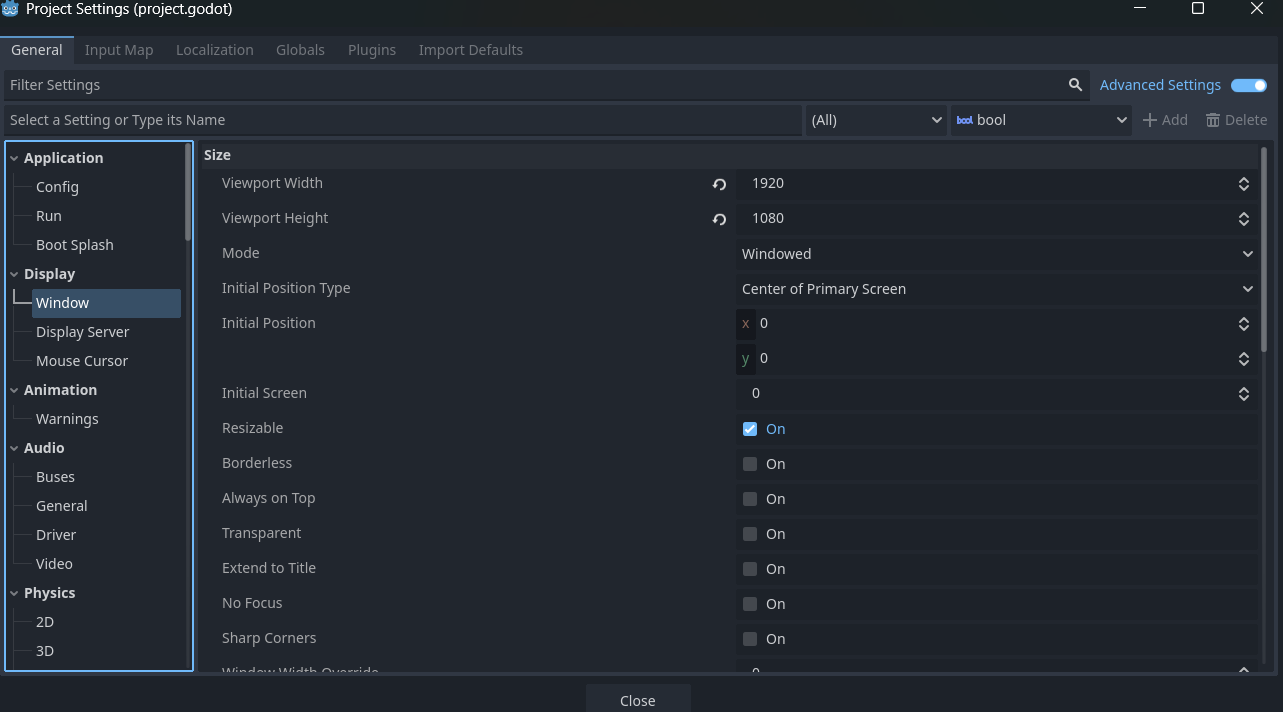
The 620 is slow on 1920x1080, I would bet it’s the rendering. Maybe compatibility render is a little bit faster?
(My first posting, after a year just reading here)
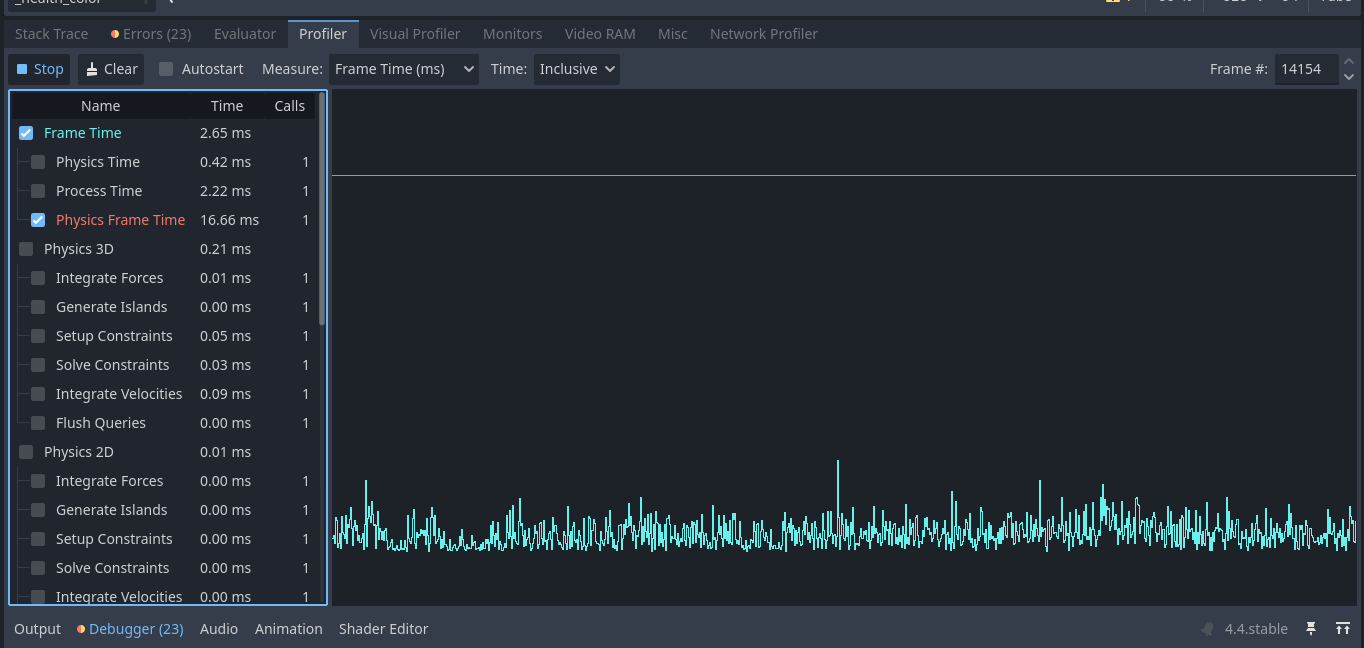
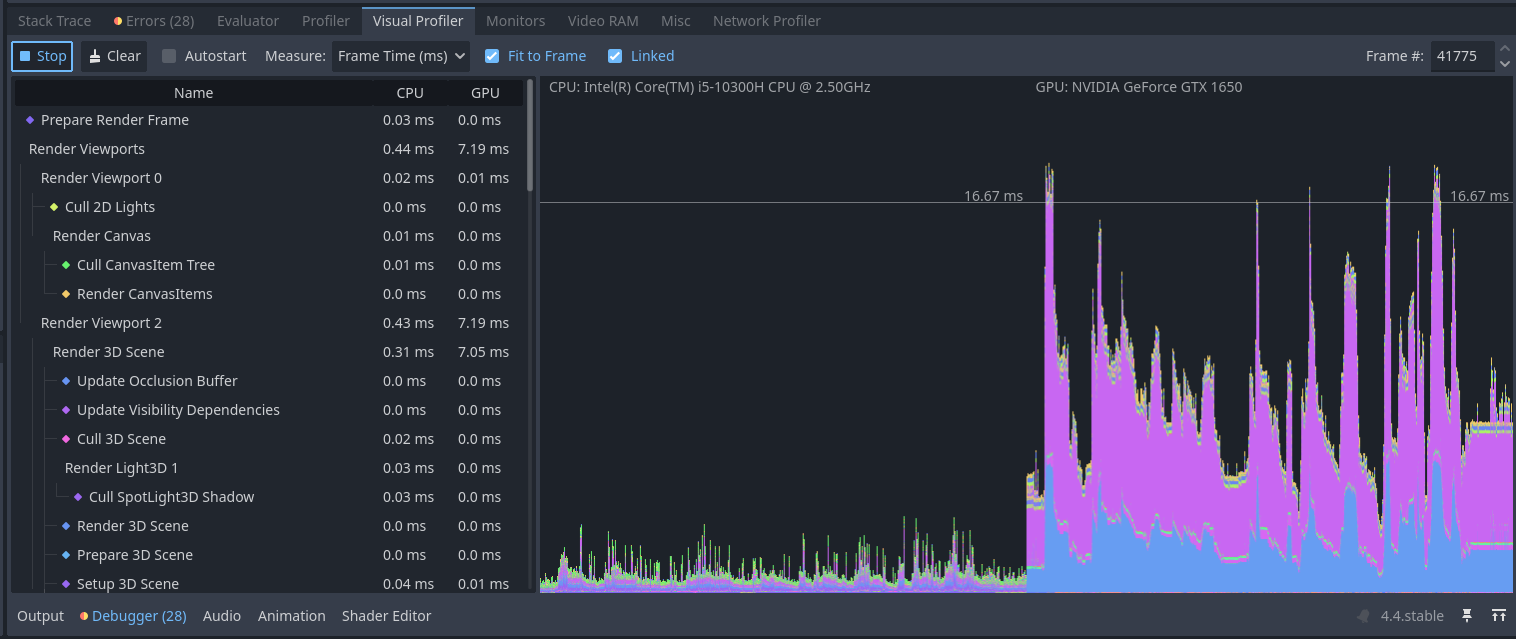
I launched the profiler, what should I take a closer look at? My development computer is running the game smoothly, can’t understand why it may not have the dedicated graphics card.
That seems to be ok. There is no heavy code running. Physics is special as it runs always with 60fps (default). 16.66ms is 60fps. (1000ms per second, 1000/60 = 16.66ms).
And your code only takes 2.65ms, that’s easy.
The Profiler tells you the time for the code computation per frame.
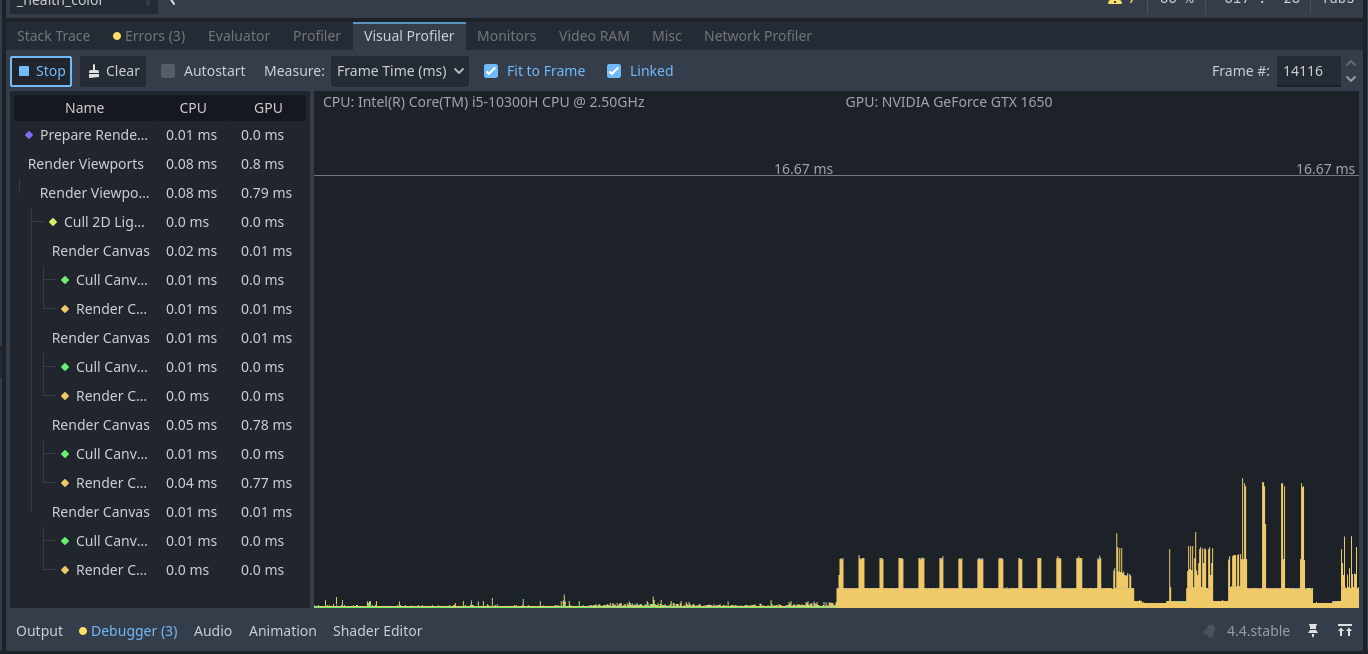
Now check the “Visual Profiler”, there you can see the rendering performance. It seems there must be the bottleneck.
For your final game you don’t ship the godot editor with you game. There you’ll make a build of your project. As final step you must export (under project) your project for the different OS. But you’ll need to download the right build templates for this.
There are two types of builds, debug and release. Debug builds will have some additional functions for logging and debugging etc. They are a bit slower than release builds. But both should be a bit faster than running in the Editor.
So a release build of your project could run faster than the 30fps on your slow PC.
Profile on the problematic machine as well. You might want to look at the visual profiler too. It specifically measures the graphics performance, which is likely your actual bottleneck here.
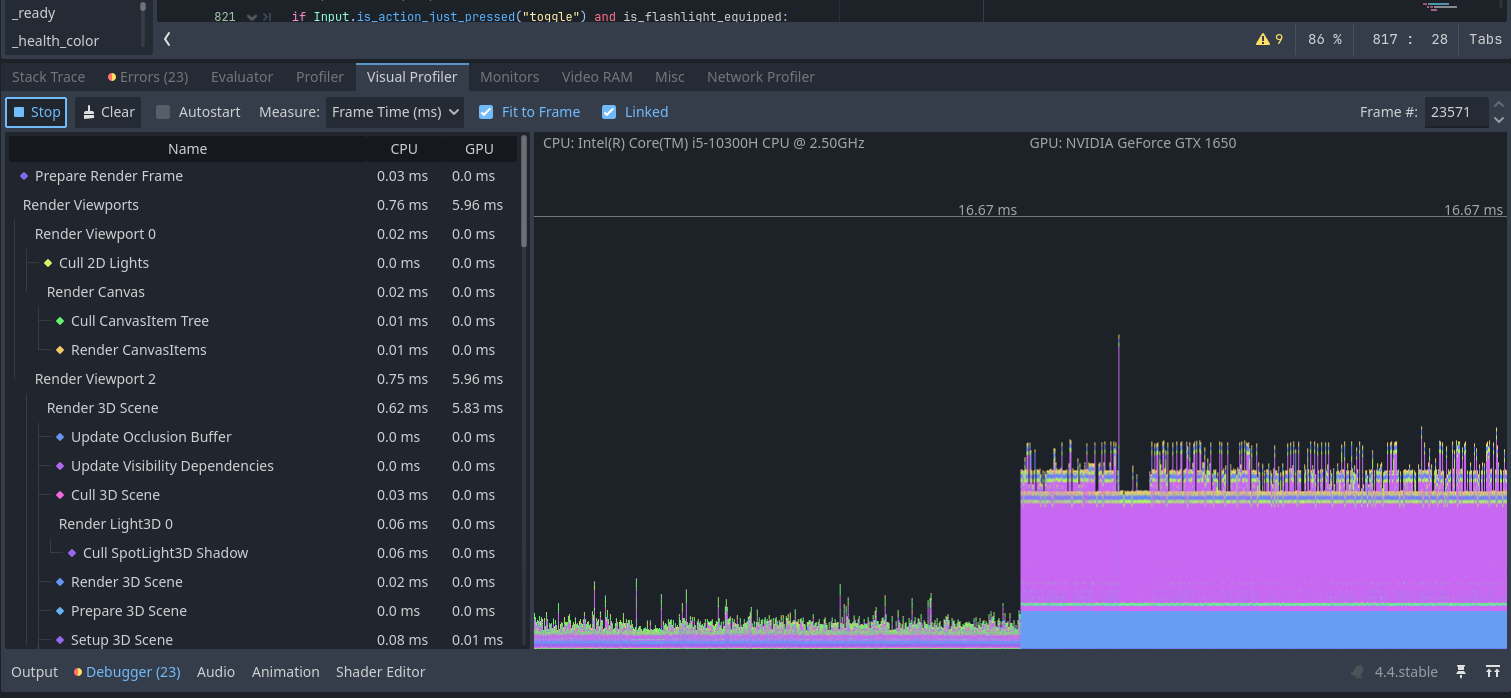
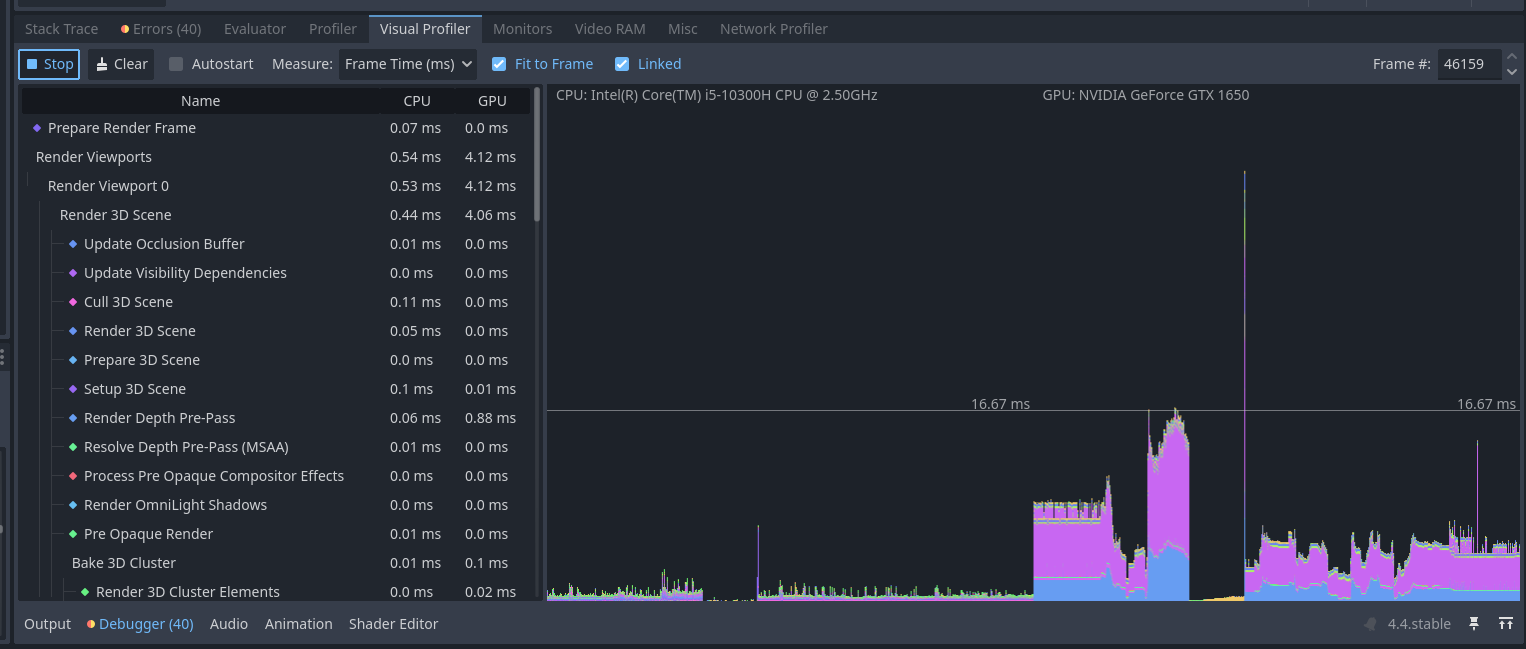
The fourth one indicates the state of the game when I change scenes by entering an Area3D which teleports me to the next stage, where the previous one does not exist anymore.
At first I suggest to clean up your debugger. There are a lot of errors and warnings.
This is on your fast machine? Only some spikes below 60fps. The huge spike in the last (visual profiler) shot is expected, as it seems that’s the moment where the new scene is loaded.
In your third screenshot check the spikes over 16.6ms. You can click in the chart at one spike, than check the timing on the left. The chart is split in half, one side is your CPU and one side is your GPU. It’s clear that the bottleneck is the gpu.
Yes, that’s my working computer, the errors are about yellow warnings like what a particular monster is doing at the moment and not used functions. They don’t affect the game process, but perhaps could be a reason why some parameters in my visualizer are different from what it should be.
Just looking at the profiler is of no much use. You need to determine which rendering tasks are taking up most of the time. Click on the pink and blue parts on the chart and see what they are, It’ll select the category on the list when you click.