One step ahead of you, I sent some friends the exported game which is how this was found. I have a lot of ram so it wasn’t as noticeable for me but after about 10 matches on my friends’ end the game would start chugging really bad before crashing.
Have you checked the remote-scene-tree for any suspicious nodes?
you can also print orphan-nodes i believe:
print_orphan_nodes()
Mhm, nothing suspicious there
If you still have red error msgs, show it
E 0:00:00:0155   _debug_messenger_callback: GENERAL - Message Id Number: 0 | Message Id Name: Loader Message
	loader_get_json: Failed to open JSON file C:\Users\jenny\AppData\Local\Medal\recorder-3.529.0\Host\medal-vulkan64.json
	Objects - 1
		Object[0] - VK_OBJECT_TYPE_INSTANCE, Handle 2975217646784
  <C++ Source>   drivers/vulkan/vulkan_context.cpp:267 @ _debug_messenger_callback()
It’s just this, twice. No idea what it means. Other errors are about variables never being used and are yellow.
Seems like it from MedalTV and it strange to me.
Only can offer to add below code as first line in every function in ball and character scripts, may be else
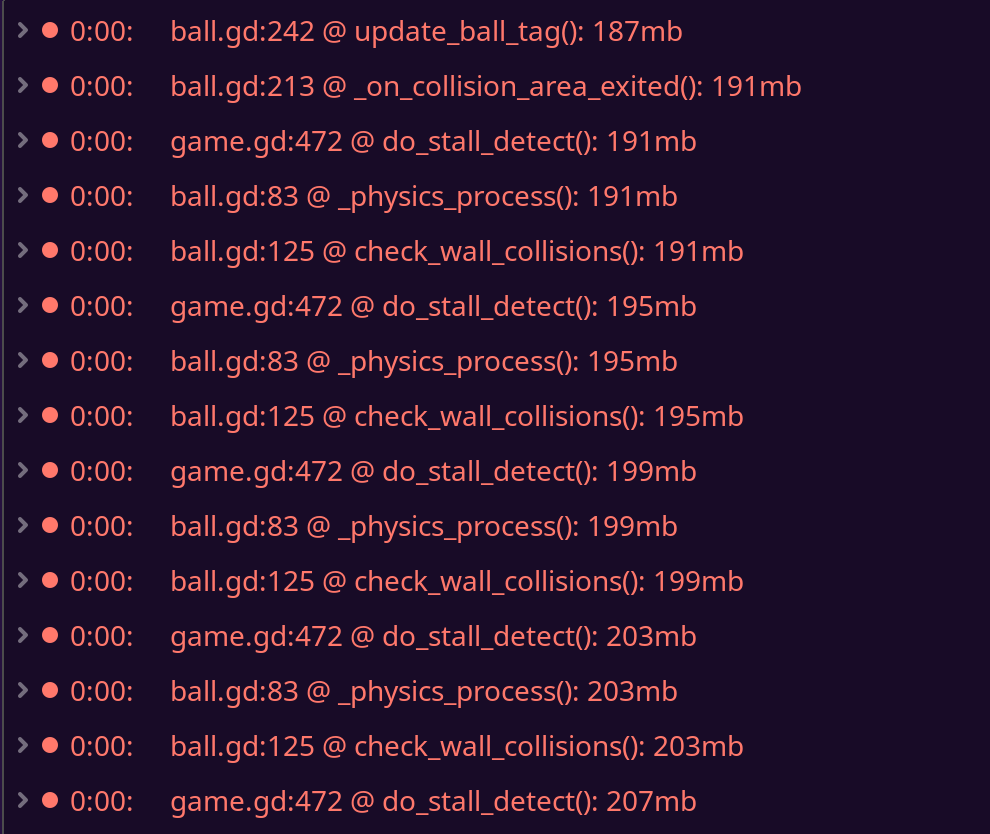
push_error( str(OS.get_static_memory_usage() / 1024 / 1024) + "mb");
It prints memory usage as error with function name and with reading error log it can be posible to see at least after what function it grows.
As it will first line function, really guilty will previous function
load on it’s own won’t cause a memory leak, load only reserves new memory when it’s the first time the resource has been loaded. Instantiating and duplicating resources can leak memory, but resources are ref counted and free themselves when no longer tracked; so instantiation may be your best bet.
The video/texture memory increasing along with objects makes me think something must be instantiated and maybe unique textures being created.
I disabled every shader and it still happened which is really weird. Nothing in the code is applying textures, just changing the ball albedo colour when tagged.
I added this to the suspect functions and these two seem to be the culprits. Everything else was disabled and didn’t affect the issue at all so I didn’t add the error pusher to them. Apologies in advance if either of these functions are horrible. Even when disabling the animations on the HUD elements (I thought that could be causing it) the same would happen.
Again sometimes this happens and sometimes it doesn’t. I’m considering making the current source code public just in case anyone more knowledgeable than me can find the issue, would that be a good idea? Thanks everyone for all the help so far.
func check_wall_collisions():
	push_error( str(OS.get_static_memory_usage() / 1024 / 1024) + "mb");

	for i in range(get_slide_collision_count()):
		var collision = get_slide_collision(i)
		if collision:
			var normal = collision.get_normal()
			$wall.pitch_scale = 0.9 + randf() * 0.2
			$wall.play()
			if abs(normal.x) > abs(normal.z):
				direction.x = -direction.x
			else:
				direction.z = -direction.z
			break
func do_stall_detect():
	push_error( str(OS.get_static_memory_usage() / 1024 / 1024) + "mb");
	if !Global.cooldown:
		stallers = [false, false]
		var overlapping_areas = Global.ball.stall_detect.get_overlapping_areas()
		#print(overlapping_areas)
		for area in overlapping_areas:
			if area.name == "StallL":
				stallers[0] = true
			if area.name == "StallR":
				stallers[1] = true

		if stallers[0] and !stallers[1]:
			if !debounce1:
				Global.players[0].stall.start()
				debounce1= true
		else:
			Global.players[0].stall.stop()
			debounce1= false
			if stall_unfuck_frames_p1 != 0:
				stall_unfuck_frames_p1 -= 1
			else:
				if Global.players[0].stall_timer != Global.stall_penalty_timer and Global.players[0].stall_timer != 0:
					Global.players[0].stall_timer += 1 # fix this for tagging
				stall_unfuck_frames_p1 = Global.stall_penalty_recharge_tick_frames

		if stallers[1] and !stallers[0]:
			if !debounce2:
				Global.players[1].stall.start()
				debounce2= true
		else:
			Global.players[1].stall.stop()
			debounce2= false
			if stall_unfuck_frames_p2 != 0:
				stall_unfuck_frames_p2 -= 1
			else:
				if Global.players[1].stall_timer != Global.stall_penalty_timer and Global.players[1].stall_timer != 0:
					Global.players[1].stall_timer += 1
				stall_unfuck_frames_p2 = Global.stall_penalty_recharge_tick_frames

		if Global.players[0].stall_timer == 0:
			stall_punish(0)

		if Global.players[1].stall_timer == 0:
			stall_punish(1)


		if Global.players[0].funny:
			$HUD/P1/Super/Timer/anims.stop()
			$HUD/P1/Super/Timer/anims.play("tick")
			if Global.players[0].stall_timer <= 3 and !Global.players[0].stall_timer == 0:
				$HUD/P1/Super/Timer/tick.play()
			Global.players[0].funny = false

		if Global.players[1].funny:
			$HUD/P2/Super/Timer/anims.stop()
			$HUD/P2/Super/Timer/anims.play("tick")
			if Global.players[1].stall_timer <= 3 and !Global.players[1].stall_timer == 0:
				$HUD/P2/Super/Timer/tick.play()
			Global.players[1].funny = false
If you seen big grow in do_stall_detect real grow was in function before, because above code measure memory as first line.
You also can add this line in any other place, for ex. before every if inside function or at the end of it to locate line of code.
How and why do_stall_detect called?
Did it called before, in log above?
If see pattern:
update_ball_tag
on_collision_area_exited
and then repeated
do_stall_detect
_physics_process
check_wall_collisions (called from _physics_process)
It’s called every frame. In that function it checks if the ball is in P1’s court, P2’s court or both. If it’s not in both it’ll tick the respective player’s stall timer down. Disabling this function entirely doesn’t really change much, memory leak still happens
Honestly, ideas is over. It can be one of many things. Like saving data in globals for example.
if you still have a desire - only measure every function call:
At function start
var mem_at_start = OS.get_static_memory_usage()
at function end or before return from function:
push_error( str((OS.get_static_memory_usage()-mem_at_start ) / 1024 / 1024) + "mb");
This pushes errors saying 0mb is used
I’ve tried absolutely everything and it’s still happening. Even if I fix the thing that makes memory randomly start crawling up every frame, I have absolutely no idea where to even start with fixing the 34mb memory increase whenever someone tabs out and into the game. I give up
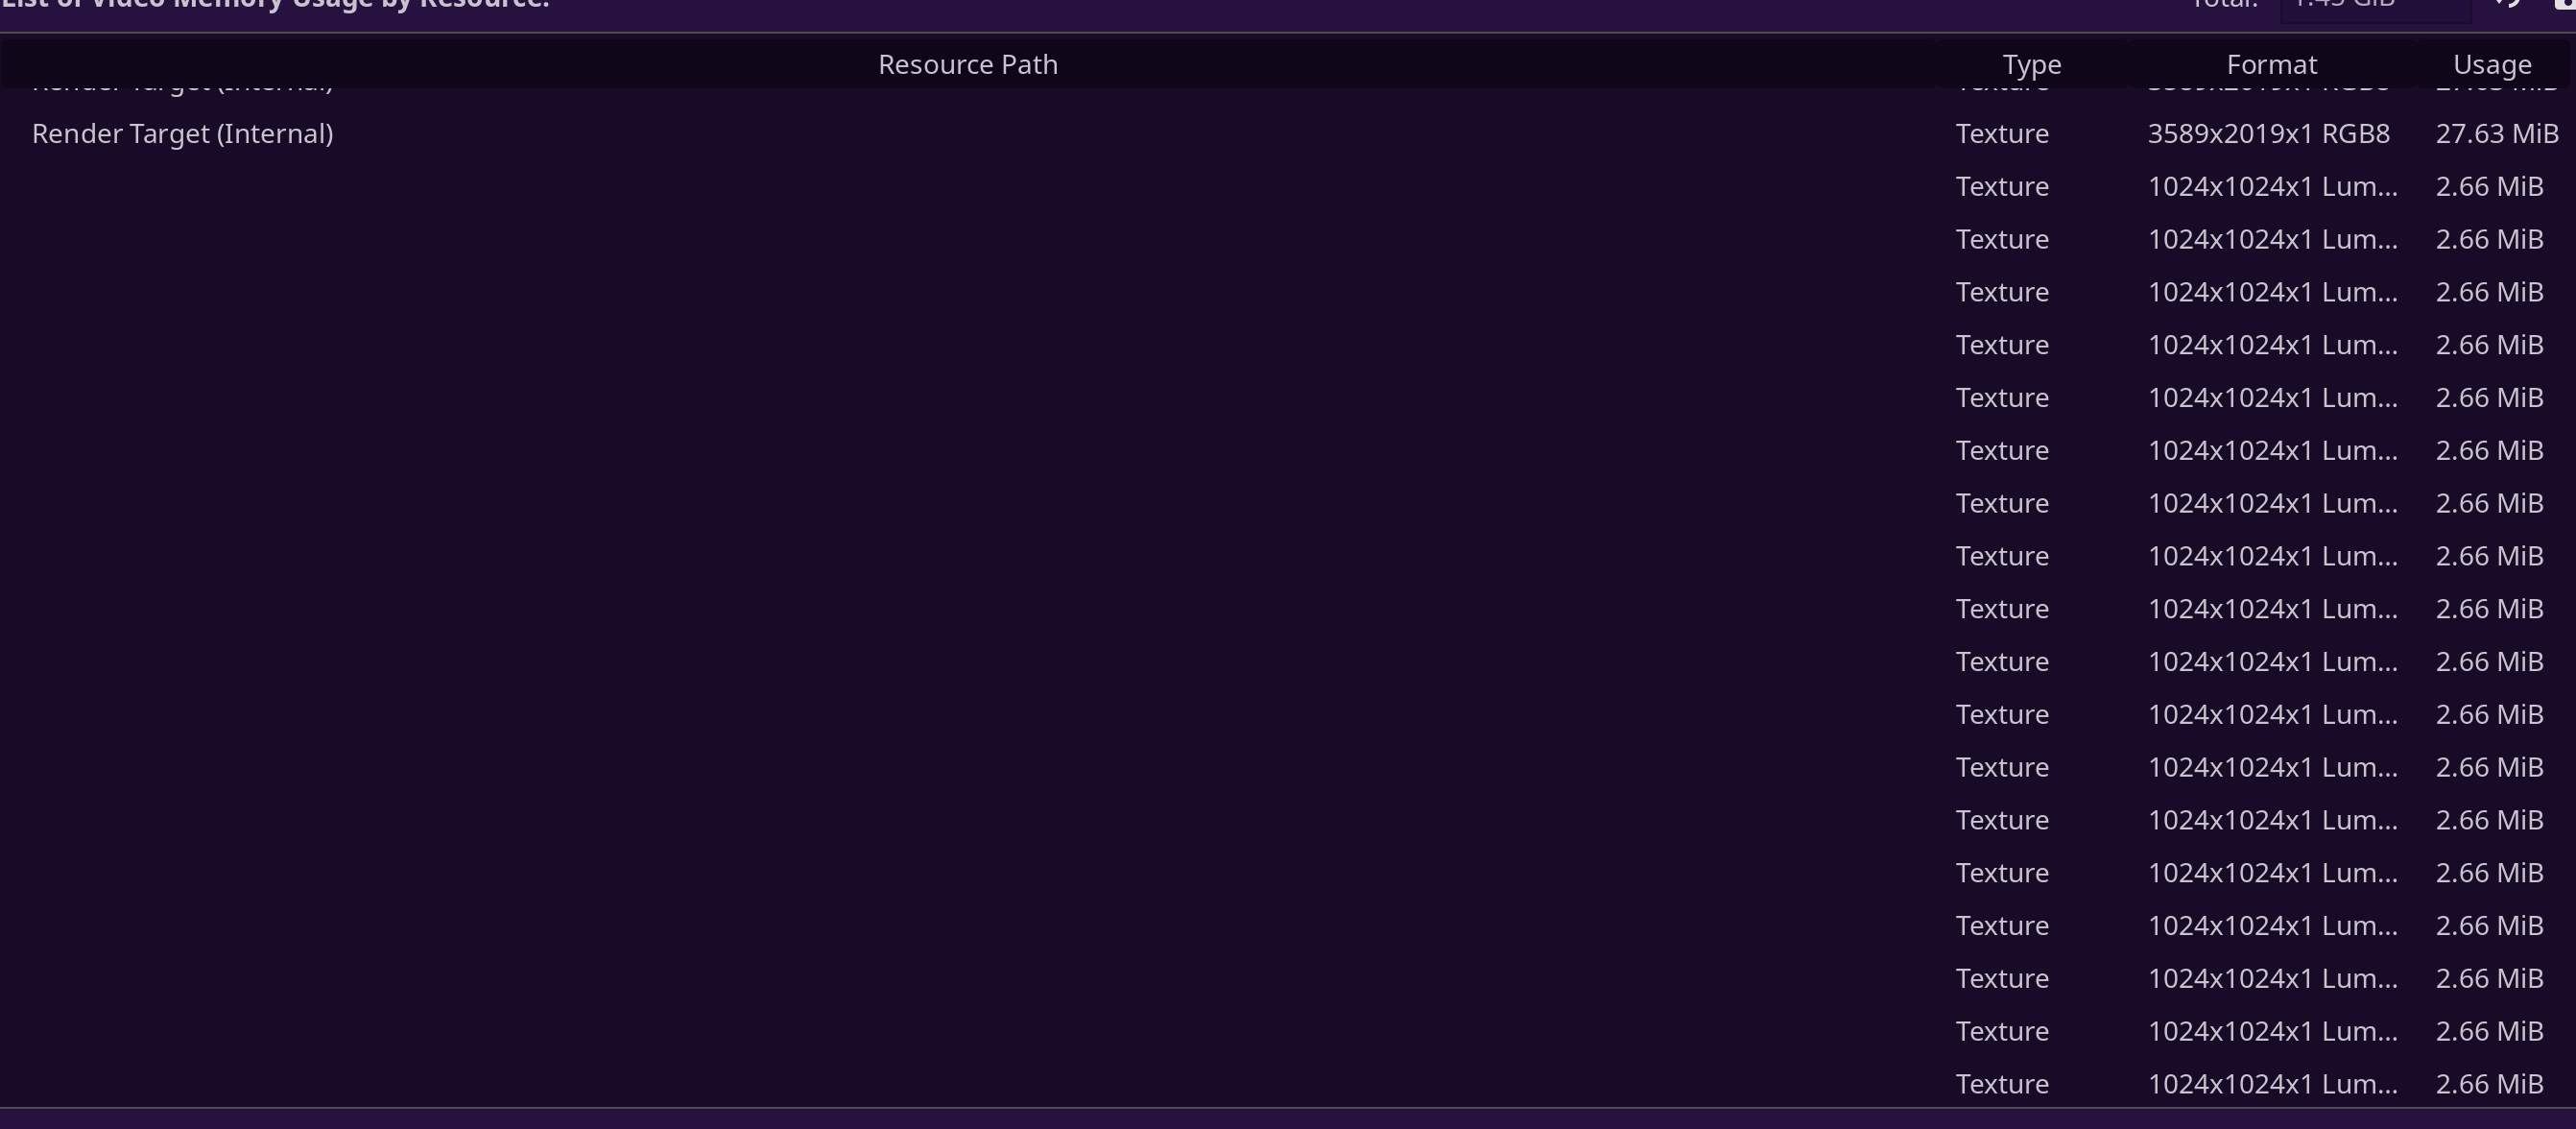
Nevermind - a friend suggested using the latest Godot version that has functioning video memory debugging or whatever it’s called.
There’s an absolute ton of nameless textures being created out of nowhere.
How can I track down where these are coming from? None of my game textures are 1024x1024. The characters only have textures on the face, hoodie and boots, and all of these are 64x64 aside from the face texture which is 320x320 and has every expression as some kind of screwed up spritesheet.
The issue is with an animated FontVariation on a Label node. RAM use increases extremely fast, even faster when maximised. Unsure if this is a me problem or an engine problem so I submitted an issue. Thanks for the help everyone!