After a period in early access, Paragraphic 1.0 has now been released.
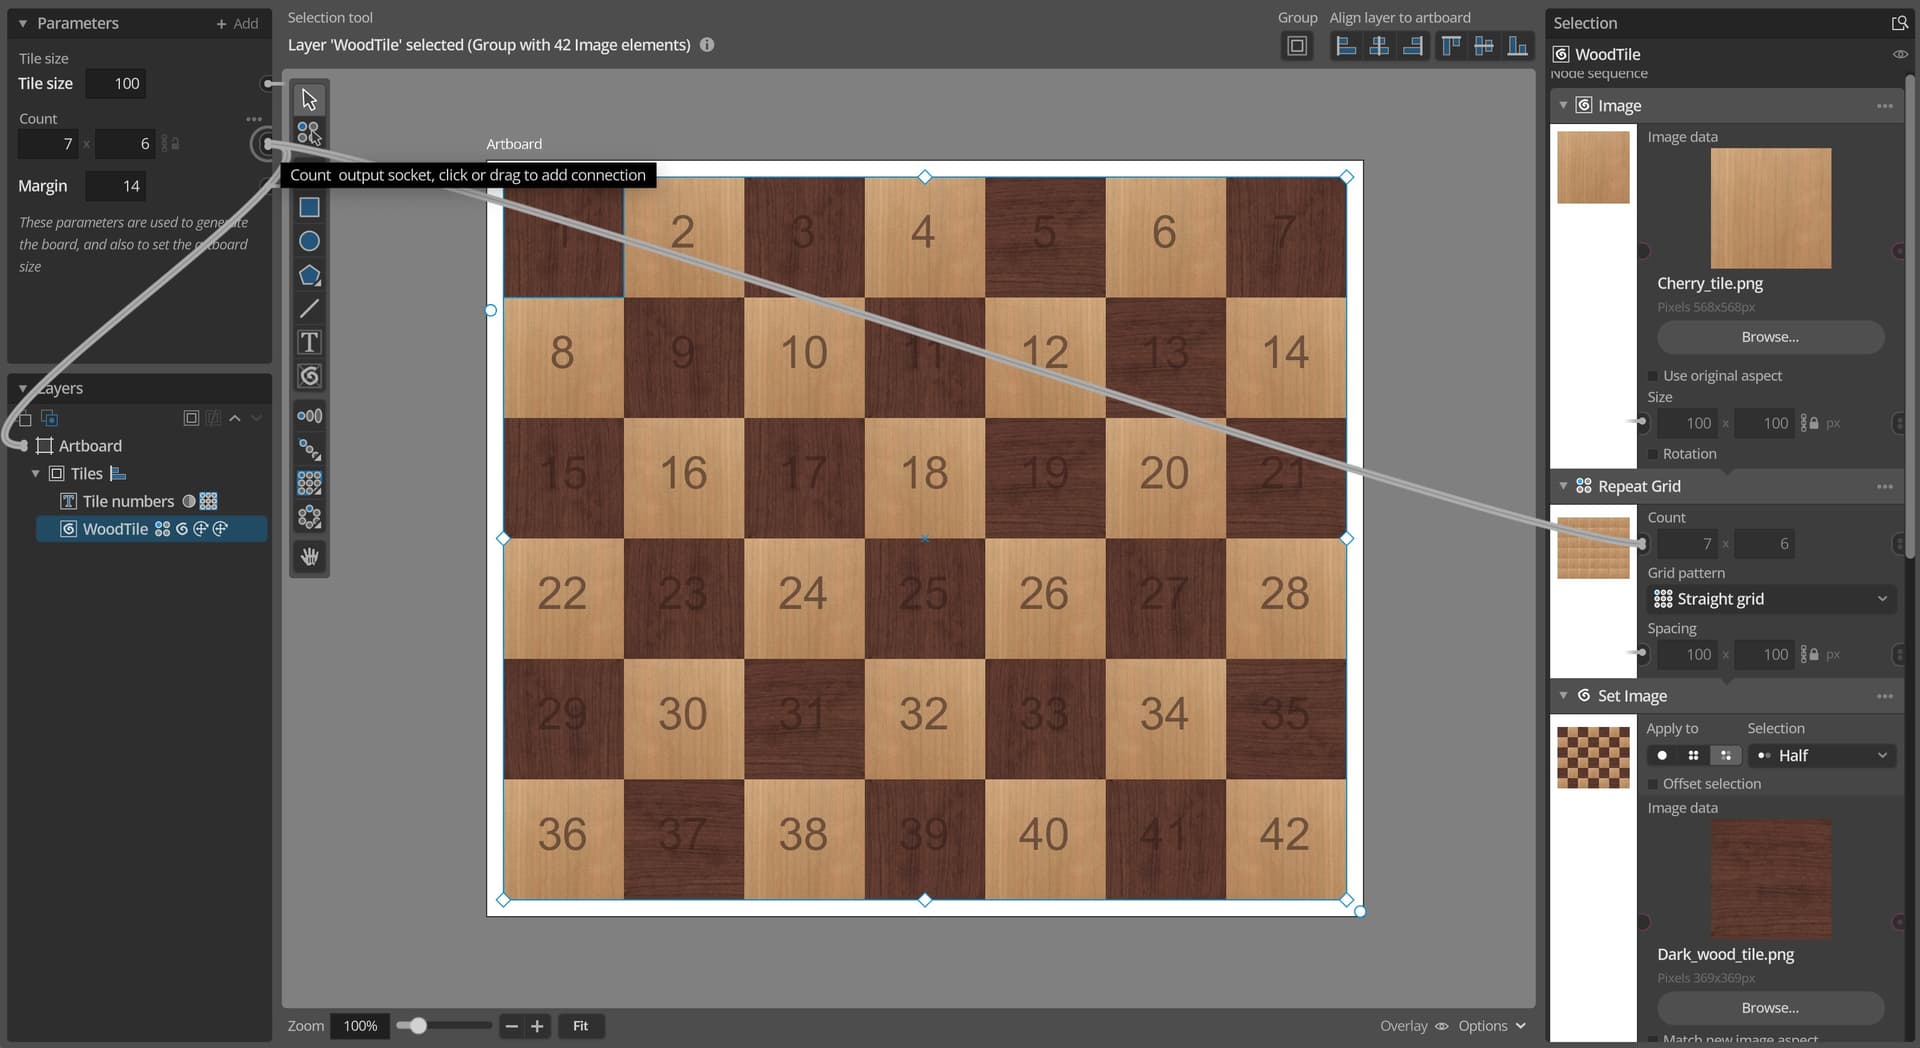
Paragraphic is a new cross platfrom parametric graphic design application, combining traditional illustration tools with powerful procedural design features.
As others have said in the previous thread, very nice software. Stuff like this really showcases Godot’s future for real software development.
I have many projects lined up and seeing this just thrills me because I knew Godot was capable. There are other great applications but this showcases the rendering depth and eloquence that can be achieved with procedural graphics.
It’s all GDScript. If I knew how I would probably have done some parts in C# to get better performance, and I might need to learn and do that in a future update. But for this first release I prioritized functionality and getting it done before performance, so I went with GDScript as it was easier for me to work with.
Ah ok, yeah that is why I asked. I have a really heavy math/graphic application I am porting and started in gdscript. Was pretty bad performance but, then reported to C# and the render speed was night and day.
I will probably even go C++ for the rendering and stay in C# for the application/model layer for easier unit testing.
Good to hear that it was doable. I’ll probably keep most of the logic and UI stuff that is the majority of all the code in GDScript, but hopefully be able to port some custom path classes that deal with my vector paths (like calculating path bounds, hit detection etc) and custom elements (my generated graphical entity objects) to C#.
maybe a bit thing to bite off, but building in a timeline tools to produce gifs/vids - just like the seconds 1-3 of your video would make it stand out a lot
i’ve seen software kinda like this for stuff like Canva but they lack vid/gif the procedural shapes
and embedding into godot sounds really cool actually for the other stuff it could enable, esp b/c godot is light enough of an application - very exciting potential actually!
Yes, animation is certainly something I’d like to move into. It’s a great match for parameteric design applications like this. I’ve made other similar projects before with keyframe-based timeline animation support, so I have a fair idea of what it would involve and how to build it. One of the big things holding me back there is the lack of built in video encoding support in Godot, or access to the native OS video encoding systems.
So even if I can render the frames I can’t export the animation to any usable format (other than possibly numbered png frames). The way forward there seems to be to somehow use the ffmpeg library, as discussed in this proposal but I’m not sure how difficult this would be to do.
Regarding “embedding into godot” I’m not sure what you mean?
Just thought I’d update this thread here, since release there have been a number of updates with new features and improvements. With the second 1.2 update just released. Here’s a bit of an overview of the new features added:
I don’t see any example though that show how the resulting graphics were used in real world products and items. Maybe something you want to add to the website from a market point of view.
Like that line repeat circle being used for designing a lamp shade a laser cutter cuts out. Or any the repetitive fruit pattern with seamlessness being printed on fabric for a sewing project (I have too many projects, but there really are services like ctnbee where you can just upload patterns to be printed for you).
Feature-wise, is there a headless mode? The value visualization sample that you have could benefit greatly from that. As awesome as SVG with some javascript can be for website dashboard, converting re-occurring data into a well-defined graph as a png could be quite interesting. And to plug in that data, a headless mode is perfect. The traffic dashboard of the city I live in is update every minute but as the website is a giant mess of javascript and SVG it’s a pain to watch it load almost a minute before I can click the next chart which needs another minute to load. I’m sure you can find interesting public data near you that deserves a Paragraphic treatment.
Thank you! Examples of using the output for real world prints or products could be a nice idea, I know there are a bunch of user in the pen plotting community for example and I try to share nice examples of that when I see them. For my other products I know many users use them for packaging design and apparel for example, but that’s usually in big commercial contexts that make those results hard to know about or share. But having more examples and sample files is definitely something I want to add, it’s just a matter of what to prioritize with my limited time.
A headless mode is also an interesting idea, but not something I’ve considered since I rarely use the command line (except when forced to by some development tools) and I have no idea of how that impacts the application while running. Using such a headless mode to dynamically generate svgs in a web context could certainly be an interesting use case, if quite far from the UI-focus I’ve had currently for development. And maybe startup times are better if most of this is graphics-based that is skipped in headless mode. I am planning to expand on the data-driven design features in future updates, so that could be something worth looking into then.