Hi! I’m developing a 2D game that involves rendering thousands of entities to the screen. I’m hitting some performance limitations, but I’m not able to diagnose them.
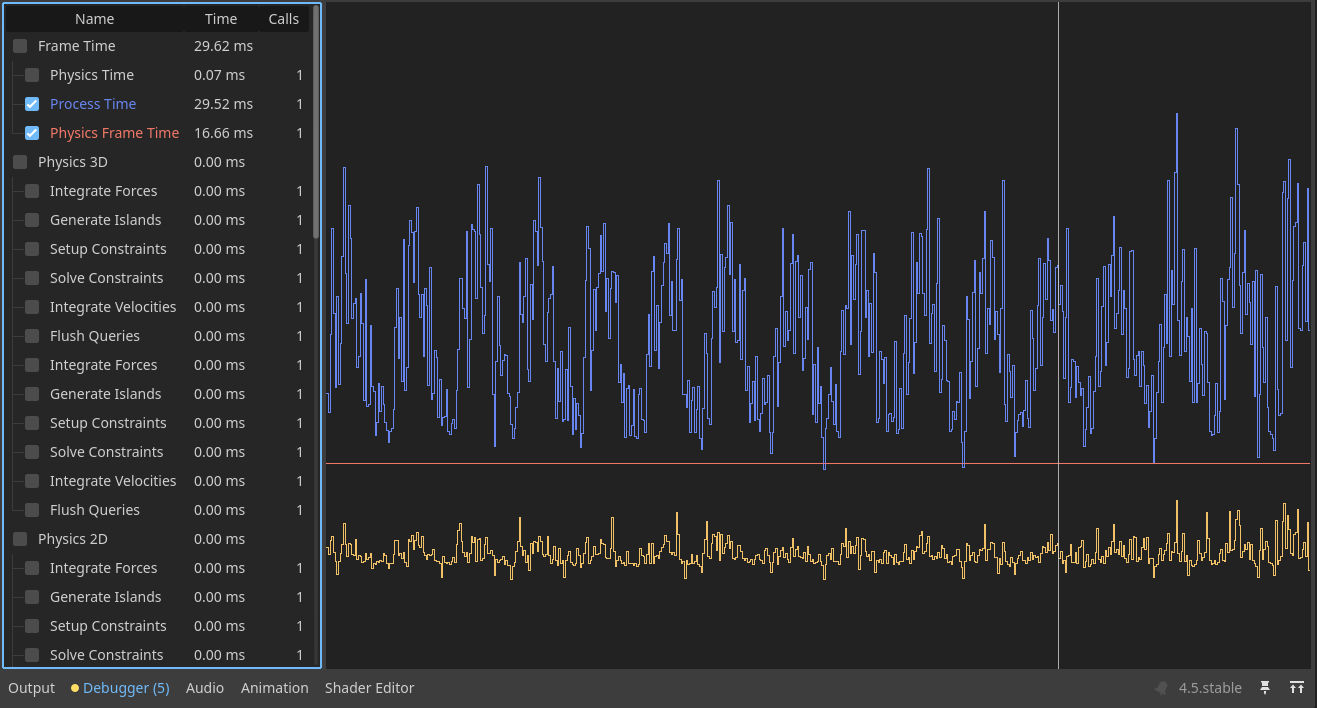
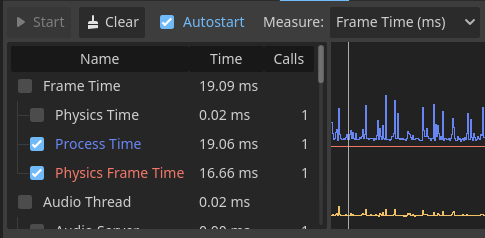
I attach the Profiler and visual Profiler views. The Profiler shows my Script Functions (yellow) hovering around 10ms, but the “Process time” (blue) shots up to around 25ms. What is included in this Process Time? It’s completely opaque.
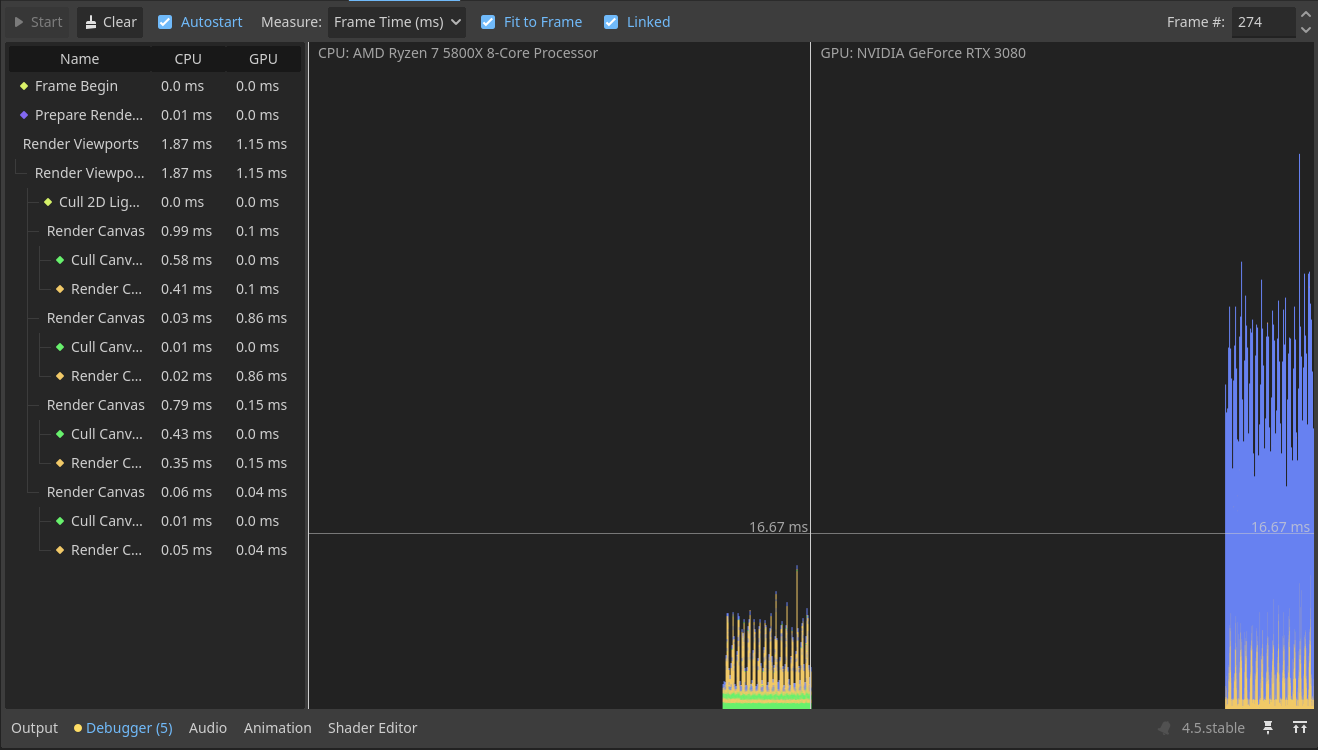
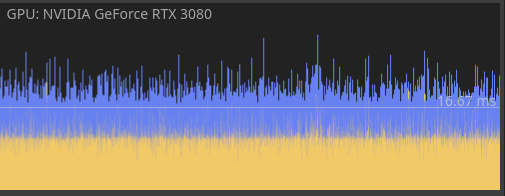
Similarly, the Visual Profiler shows in the GPU section a big chunk of blue that does not correspond with anything on the left side, and clicking on it does nothing. What may that be?
For context, I’m not using any physics objects (Physics2D and Physics3D are 0ms) and I’m using RenderingServer to draw all these entities faster. Disabling the RenderingServer logic and not drawing stuff doesn’t solve this gap in the Profiler nor reduces the blue chunk on the Visual Profiler.
From the looks of it that process time may be caused by waiting for gpu to render the frame. Your bottleneck is clearly on the gpu side. In other words you’re putting too much stuff on the screen. Look for ways to reduce the number of draw calls. Are all those entities actually visible on the screen?
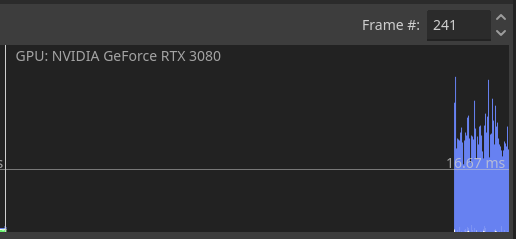
Even when disabling all entity rendering (total draw calls are just 14) the Visual Profiler stills shows the big blue chunk. The Profiler is similar, with a gap between Process Time and Script Functions.
The docs do mention the Process Time (Idle Time). My guess is it includes everything done in SceneTree:process() . You may have to disable chunks of code one at a time to figure out what part causes it.
Can’t find anything on the gpu profiler, but it is unlikely that you have enough entities to overstrain a 3080, especially if as you say you disabled drawing and that changed nothing. More likely it’s stalling waiting on something. Maybe something causes CPU and GPU send data back and forth multiple times each frame, no idea really.
Yeah, make sure you’re not doing that although it should be shown in the cpu section of the visual profiler.
@fernandossmm Can you show what exactly are you doing with the RenderingServer each frame? Are you 100% sure you’re not exchanging any data between cpu and gpu every frame?
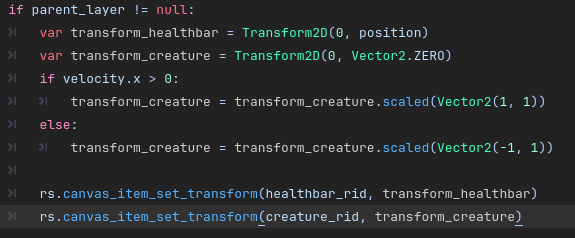
The only thing I’m doing every frame using the rendering server is updating the position and scale of the entities (creatures). I don’t know how to get data from the GPU, so I don’t think I am.
Okay, I’ve made a reproduction. Still shows a big difference between Process Time and Script time, and the blue section in the Visual profiler is still there, although smaller. It seems to be proportional to the process time. Indeed, adding an artificial delay (OS.delay_msec(100)) in my script increases the blue chunk. So the blue chunk may just be waiting for the CPU to finish processing, although it would be better if it was indicated somewhere.
The reproduction project is in this link, if you want to take a look.
The structure is:
A main scene, that spawns and stores the creatures and contains the UI
Each base_creature takes care of its rendering and stats in _process, and has a State machine
Each state machine has a single Idle state, that changes the velocity of the creature once in a while.
Unless Godot is choking by the “huge” amount of nodes (about 8000) I have no idea what could be causing this Process Time. And a quick Google search indicates that no, 8000 isn’t reaching Godot’s limits.
I thought you were going directly with RenderingServer to avoid nodes altogether. So you do use a node per entity?
For start, It may be more efficient to just use nodes in a normal way. You’re doing the script processing per node either way plus updating transforms to the gpu from script. Better to leave that to engine native code.
You should also not use node based state machine with that many objects.
Your current setup does not really benefit in any way from creating canvas items on the rendering server. Try to setup a node-less system and see how that performs.
EDIT:
So there are 2 major bottlenecks. First is as I said above is your processing function which runs on every node.
The second is your BaseCreature::draw_healhbar()
The latter creates 2 rects per healthbar and unlike the textures, the engine’s renderer seems to be not optimizing all of them into instanced rendering single draw call. Instead it isues a draw call per rect which is enormously wasteful. Comment the addition of those rects out and see what happens with the number of draw calls and fps. Try drawing transformed textures here instead of rects.
Also put set_process(false) at the end of BaseCreature::draw_healhbar() (to run it only once for positioning and then disable it) and see how that affects the frame rate.
Doing both for 8000 instances I got from ~10 to ~180 fps.
I’ve followed your advice, and here are my findings:
Removing the nodes and using code, just by itself, gave a performance boost.
Using Node2D.position as a variable was slower than using my own pos. As I wasn’t using it other than for scripts, it works out fine. It would break physics if I had any.
RenderingServer.canvas_item_add_rect() is very slow and cannot be used for thousands of items. Using canvas_item_add_texture_rect() with solid colored textures is better.
I wanted my entities to move, so set_process(false) didn’t work for me. I ended up using staggered updates (entities update in batches of around 1000 per frame). That limits the performance impact of the process function.
The results are staggering! From 2000 units at 20fps to 2000 at 350fps and 10000 at 60fps.
Btw why bruteforce this? You don’t really expect having 10000 units on the screen at any given time? And what’s not on screen should be treated differently than what’s on screen. That may be your primary line of further optimization, i.e. decouple the visual representation from the model.
Upon further investigation, we were missing something else. There wasn’t a problem with RenderingServer.canvas_item_add_rect, nor canvas_item_add_texture_rect is a magic bullet. The draw calls change from 20000 to 16 because we were using the same texture for the healthbar as for the creature in our testing. As soon as you use another texture, draw calls shoot up to 20000 again.
Turns out, this is a batching problem. I found an article in the 3.5 documentation (seems to no longer be there for stable) that explains this.
When using 2 textures, or a texture and a rect, the CPU had to call the GPU each time: draw this texture, draw this rect, draw this texture, draw this rect…
The solution is to “force” batching. You can do that by having all of the textures in a CanvasLayer and the rects in another, or by changing their Z-Index so they all match. More info here.
I ended up using a Z-Index for the sprites and another one for the 2 rects that make up the healthbar.
You may still want to though. The idea is not to store data per allocated object but group each relevant property into a continuous arrays to maximize cpu cache hits when iterating. You also might want to iterate with something faster than GDScript, at least C# or native code for the maximum performance.
Btw, what type of game this is with 10000 units visible on screen? How do you control that many units as a player?