onegm
1
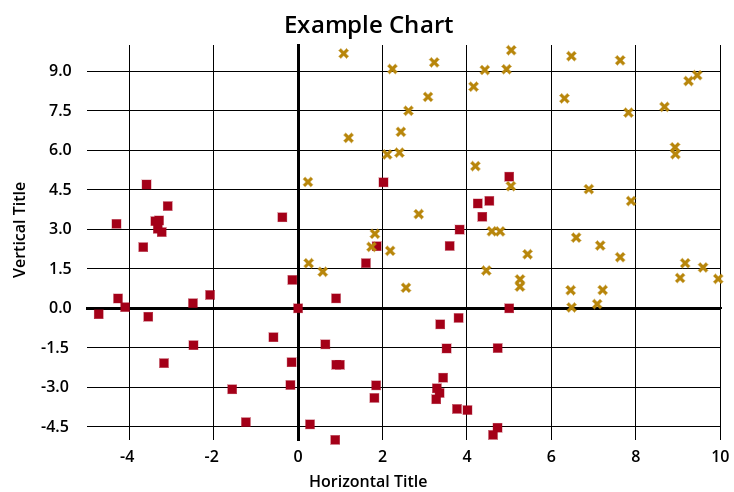
Create 2D scatter plots, line graphs, or area charts. Works in the editor as a @tool.

6 Likes
onegm
2
Multiple shapes for scatter plots are now available:
- Circle (filled / unfilled)
- Square(filled / unfilled)
- Triangle (filled / unfilled)
- Star (filled / unfilled)
- X
2 Likes
onegm
3
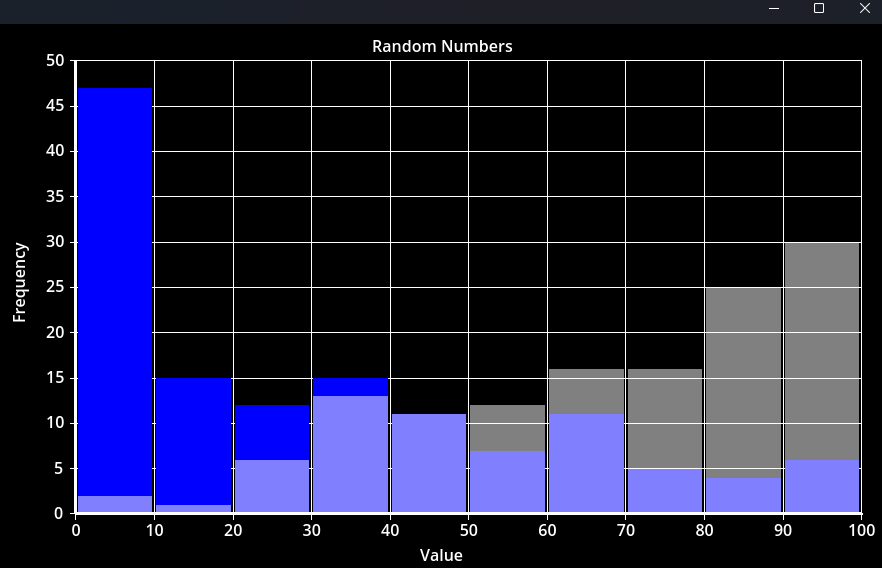
Histograms now available:
2 Likes
onegm
4
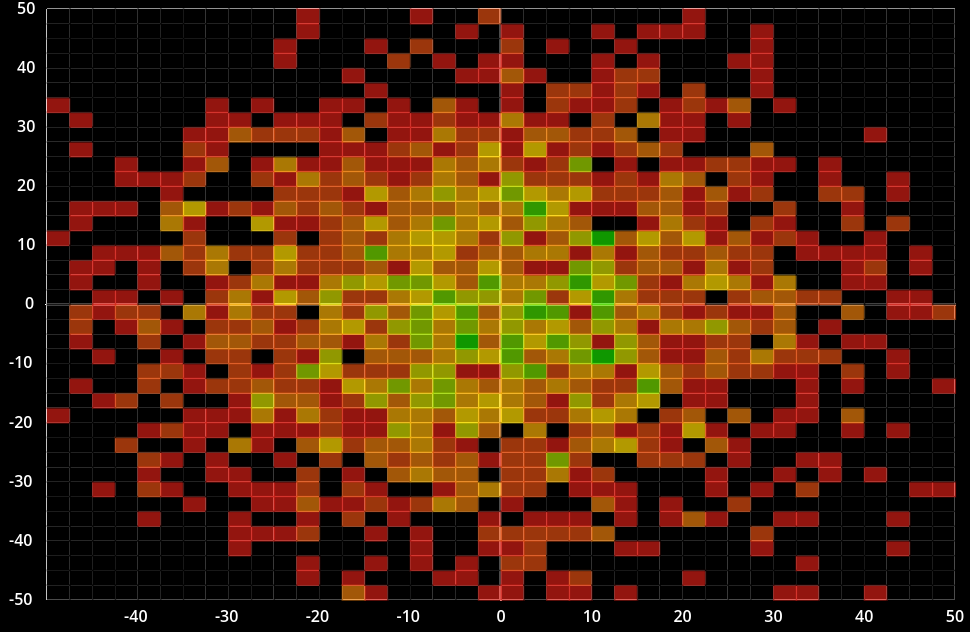
Heat maps now available with customizable color gradient and same gridline customization as other 2D graphs.
4 Likes