I’m not sure how I would make sure of that, but I can’t imagine that it should be coming up, especially that consistently. I don’t know why it just now occurred to me, but I have an old laptop I can try to reproduce it on. I’ll try that tomorrow, since it’s getting rather late where I am.
The only reason I ask is that the wait is very “consistent” with something in the background waiting for you to go idle (as in no keyboard or mouse I guess while the blank screen is up) before deciding to do something that is affecting godot in some way.
The screenshot you posted from the task manager is only showing all the cores averaged together, but you should have 16 graphs on there if I am reading your processor specs correctly. You could enable a graph for each core and see if a few of them happen to busy before you run your test. It’s possible that some windows process is moving your godot busy test to some core that happens to be doing something else at the same time, which would tank the speed. Windows isn’t suppose to do that, it should be smart enough to know; don’t move your task to a busy core instead of a free one, but well, it is windows. 
There’s only one response to this thread that really matters…

That makes perfect sense, uncapped (depending on hardware) you could be talking upwards of 1000fps. So you are iterating through a million numbers a thousand times a second and wondering why.
If you want to stress test your CPU , this is the right way to go about it.
Never put a while loop in process, that would (should) completely lock the application up.
Also have you tried enabled multithreading in the project settings (I think its off by default), if you really want to stress your CPU do that.
Aha! I misunderstood your initial post.
This makes much more sense.
I also missed the uncapped framerate, so if this works at 60 fps I’d say your problem is still probably related to the fact that your loop is taking longer than the length of the frame. Measure your FPS.
Though to @OriginalBadBoy 's point, the question of why you’re trying to do a million loops inside a frame is still valid.
Nice, a lot of responses. I’ll try and address everyone’s questions and comments on what I should do/why this might be happening.
It’s possible that some windows process is moving your godot busy test to some core that happens to be doing something else at the same time, which would tank the speed. - knightmb
That seems like a fair idea, so I went ahead and re-ran the test with the graph set to show all cores, and got the screenshot below. It looks like core 2 gets pretty busy, but it’s also busy throughout the entire program, rather than just spiking at the end.

There’s only one response to this thread that really matters… - OriginalBadBoy
Lol, nice gif. In my full project I’m not iterating nearly this many times (although it is still quite a large number). The context for what I’m doing there is that I’m iterating through every pixel of the 640x360 screen space, performing some operations and logic between them, and then feeding an array of information to a shader. There are certainly better ways to do this that don’t involve iterating over a large array in the _Process call, but I guess I’m just curious why this particular behavior is happening. I had expected to see some hit to performance, but was surprised when the real hit only happened a while after the program started.
That makes perfect sense, uncapped (depending on hardware) you could be talking upwards of 1000fps. So you are iterating through a million numbers a thousand times a second and wondering why.
If you want to stress test your CPU , this is the right way to go about it. - OriginalBadBoy
That makes sense. That makes it understandable why the vsync mode and uncapped fps affect it, but the game needing to display in “exclusive fullscreen” mode for the behavior to happen still confuses me.
I also missed the uncapped framerate, so if this works at 60 fps I’d say your problem is still probably related to the fact that your loop is taking longer than the length of the frame. Measure your FPS. - dragonforge-dev
I’m still fairly certain that Godot won’t move on to the next frame until all calls to _Process are resolved, but I went ahead and measured the framerate. I did this first by going to the monitors tab in the debugger and saw this.
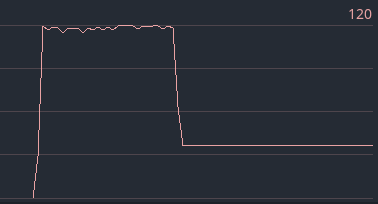
This is quite interesting. You can see at the top that the framerate hovers around 380, before abruptly dropping once the problem starts. Notably, it drops to exactly 120, which is double my monitor’s refresh rate. I wrote some code to print the framerate and time per frame once per second, and before the issue happens the output makes sense:
fps: 387.0 | msec per frame: 2.58397932816537
fps: 387.0 | msec per frame: 2.58397932816537
fps: 388.0 | msec per frame: 2.57731958762887
fps: 394.0 | msec per frame: 2.53807106598985
fps: 380.0 | msec per frame: 2.63157894736842
fps: 392.0 | msec per frame: 2.55102040816327
fps: 388.0 | msec per frame: 2.57731958762887
Once the problem starts happening, though, the output changes to this:
fps: 120.0 | msec per frame: 8.33333333333333
fps: 120.0 | msec per frame: 8.33333333333333
fps: 120.0 | msec per frame: 8.33333333333333
fps: 120.0 | msec per frame: 8.33333333333333
fps: 120.0 | msec per frame: 8.33333333333333
Finally, I was able to get the code onto another machine and see if it happened there. A bit to my surprise, it actually didn’t, it never had the abrupt spike to a higher process time. After that I was also able to hook my machine that does have the problem up to a tv in the same room, and found that the problem went away. Based on this I’m thinking that it’s probably something more to do with my specific hardware setup (specifically my monitor) than anything else.
Thank you all again for your help with this, I wouldn’t have reached this conclusion without your suggestions.
Have you considered temperature? Something thermal throttling would match all the observed things:
- only happens when not interrupted, stops happening again for a while after an interruption.
- doesn’t happen the same on different hardware.
- no apparent software explanation.
(With the fixed framerate when it slows down, I would guess the GPU is what’s throttling.)
That had been suggested in another place where I asked this question, but the issue I have with that idea is that the situation should then fall into one of two categories:
- If it’s the GPU throttling, then I don’t think that the looping in _Process would matter, since that would only strain the CPU.
- If it’s instead the CPU throttling, then the window mode shouldn’t matter, since that would only affect the rendering and, therefore, the GPU.
My best guess for what’s happening is that it might have something to do with the interaction between my monitor and my graphics driver. I have a pretty old monitor (it was already a bit old when I got it as a hand-me-down), so I wonder if my graphics driver sees the program strain from the looping, notices that the game is having screen-tearing issues, and caps the framerate at double my monitor’s refresh rate or something like that. I’m honestly not 100% on how graphics drivers work internally, but that’s my best guess.