I’m having a really weird behavior when iterating over large loops in a _Process call that I was hoping someone could help me understand. I originally noticed it in my main project, and created a smaller project to see if I could replicate the issue. I was able to replicate it using a single Node2D with the following C# script attached to it:
using Godot;
using System;
using System.Diagnostics;

[GlobalClass]
public partial class CPUSlowdown : Node
{
	public override void _Process(double delta) {
		for(int i = 0; i < 1000000; i++);
	}
}
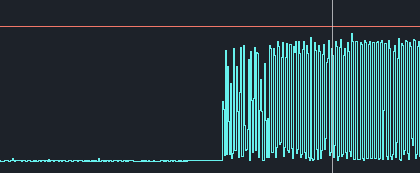
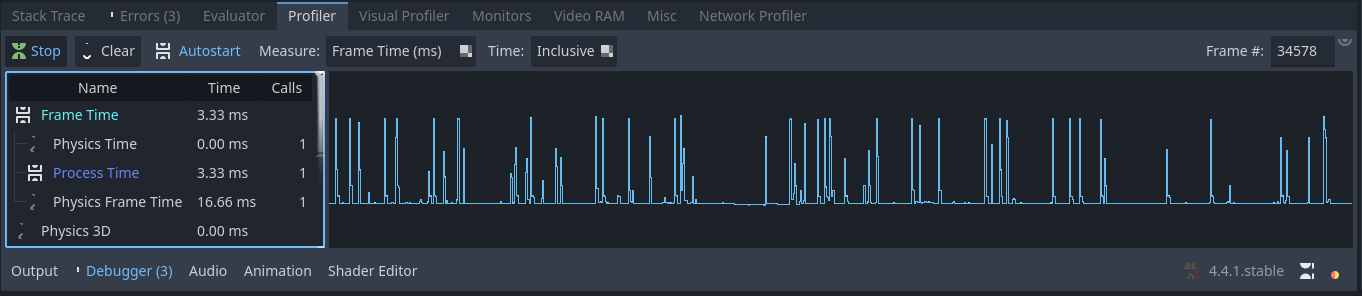
What happens is that the time taken by each _Process call is fairly low, hovering around 1.5ms. After 35 seconds or so is where the problem comes into play, as the process time suddenly skyrockets. Instead of hovering around 1.5ms, it fluctuates between ~2ms and ~14ms every frame. I’ve attached a screenshot below so you can see what I mean.
Some people that I talked to proposed that it might be an issue with C#'s garbage collector, so I tried to replicate the issue with GDScript and was able to do so with the following code:
extends Node

func _process(delta: float) -> void:
	for i in range(100000):
		var tst
Now comes the real kicker with this issue; whether or not it happens is highly dependent on the settings of the project. I’ve found that it only happens if the game displays in “exclusive fullscreen” mode, with the fps uncapped and vsync disabled. I even tried it with the mailbox vsync mode and did not notice the issue occurring. Some other things that I’ve noticed while trying to debug this:
For the issue to happen, the game must be focused for the entire ~35 seconds. In fact, the problem will temporarily go away if you tab out, only returning once the game is focused for an additional ~35 seconds.
If I make the time taken by each process call larger (by increasing the number of iterations in the loop), the baseline time taken will increase as you might expect. However, the size of the spikes after the problem occurs will not.
I was able to replicate the behavior using an equivalent while loop instead of a for loop. This is true for both the C# and gdscript versions.
I imagine that solutions to this problem would probably be things like “don’t do really long loops every frame”, but I’d like to understand why it’s happening. If any Godot wizards see this and feel like helping out I’d really appreciate it.
This post is speculation; I have no hard facts for you:
Are you actually doing anything inside the loop? gdsscript is interpreted and probably doesn’t care, but I’d half expect C#'s optimizer to notice the loop had no side effects and short-circuit around it. It may be that depending on load, the interpreter (or JIT or whatever) takes the time to optimize or doesn’t.
Nope, not doing anything in the loop, I’m able to make the effect happen using just the code above. I honestly thought that C# would optimize it out as well, but the base time per frame also increases when I increase the loop count, so that doesn’t seem to be the case.
Others had also mentioned the garbage collector being a potential issue, but if that were the case then it shouldn’t happen in GDScript.
It could; gdscript is garbage collected as well, and not optimized. If var tst winds up being created every loop iteration and then discarded, that’s a lot of garbage…
I’m using the GDScript example you posted, have it running “exclusive fullscreen” mode for over 35 seconds, then switch over to take a screenshot. The blip is probably when I was switching out of full screen to take a screen shot.
Refcounting is still garbage collection; it’s just a lightweight GC that emphasizes lower overhead over robustness. It still has to do work to clean up dead vars. If you’re telling me var tst is stack-allocated that’s a different thing entirely, but if it’s created as a heap object then whether the system uses full “can detect cycles” GC or refcounting, it’s got to do work to free that object.
Since it’s a local variable I would assume it’s just on the stack, but I’m not intimately familiar with how GDScript works. I’m fairly certain that C#'s GC shouldn’t come into play though.
How long is the process time for you while you’re doing this? For me I’ve noticed this only once I go above ~1.5ms, so if you have a better CPU maybe increasing the iteration count will cause it to crop up?
It could also be a Windows-exclusive thing. I think the fullscreen modes behave slightly differently OS to OS.
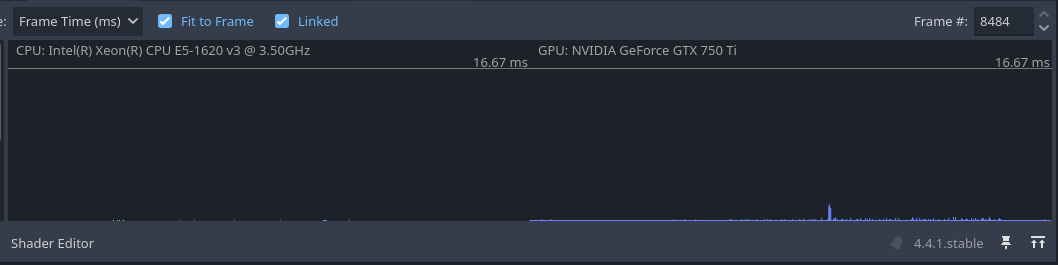
My desktop monitor runs at 75Hz, so I’m assuming (thought I might be incorrect) that 8484 frames is roughly (8484 / 75= ) 113 seconds that those graphs are showing. I haven’t played around with the performance monitoring in Godot that much yet, so the default first line starts at 16.67 ms which might be difficult to tell if those blips are above 1.5 ms or not. I do have the benefit of having the same hardware, multiple identical drives (separate for each OS) that can multi-boot Windows/Linux/etc. so I can try this out on identical hardware, just a different OS to see if it is related to the OS itself.
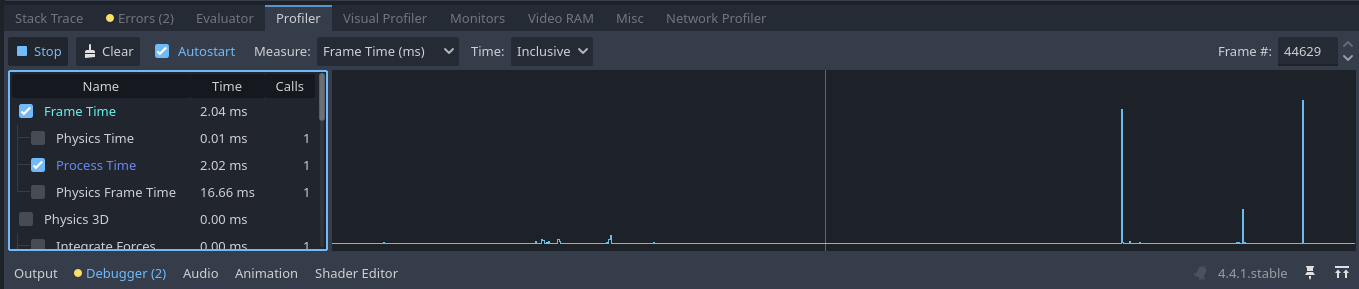
If you’re willing, I would really appreciate your attempts to replicate the issue. I should also note that I’ve been using the regular profiler, not the visual one. I don’t know if the output is super different between the two.
Also also, make sure that you disable vsync and uncap the fps when you try to replicate it, as I’ve found that having either of those active will prevent the issue.
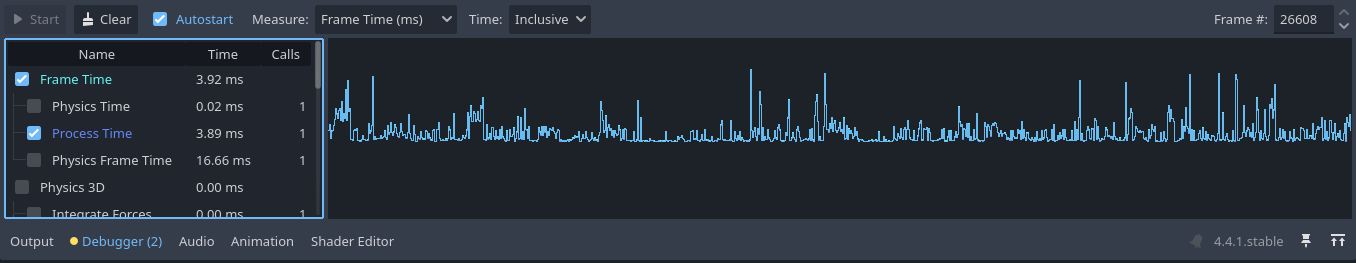
Ok, to make it all the same for testing, I redid testing via your requested settings, no vsync, uncap FPS, etc. I then used the regular profiler and redid the test across Linux, Windows 7, and Windows 10. Each test I let it run full screen for at least 60 seconds before switching over to grab a screenshot. These are all on the some PC, just physically different drives so I can choose which OS to boot for testing.
I also re-ran the same test on the same OS and let it sit for +5 minutes just to see if anything happened in that time and nothing showed up that was starting to kill the CPU time, pretty much remained the same. I don’t know what the average FPS were being generated since it was just a blank screen during the test.
Dang, okay, maybe it’s just a weird thing with my machine then. Thanks again for giving it such a good try! I’ll probably just end up leaving the vsync mode in mailbox , since that nullifies the issue while still letting it run fast.
So every 16.666 milliseconds you are running a loop for 1 million iterations, which at best take 1.5 ms per iteration. So best case every 16.666 ms you are kicking off a process that runs for 25 minutes. What exactly are you expecting to happen? Are you expecting the loop to stop when the the next process executes?
What I suspect is you are overloading the processor because after 35 seconds you have ~2k+ processes running for another 25 minutes.
TBH I’m surprised you’re not experiencing a core dump or memory leak.
What’s the Performance tab in Task Manager on Windows saying? Or top on Mac/Linux?
I think you may have misunderstood. I don’t start a new process every frame that runs for 1,000,000 iterations, I run a loop for 1,000,000 iterations on every call to _Process (the method that runs once every frame). This should mean that, before a frame is rendered, the loop will run for 1,000,000 iterations, with the frame only being shown once that is complete.
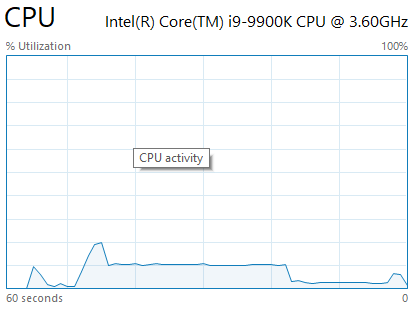
I’ve gone ahead and attached a screenshot showing how it looks in the performance tab of task manager. You can see that it never exceeds 20%.
Yes, and unless you changed it in your project settings, process runs 60 times a second by default - but is tied to your application’s framerate.
If your framerate is dropping below 1 then this would be true. It’s also possible that if this is true, you are dropping your framerate to one frame per 25 minutes and in fullscreen exclusive mode your videocard doesn’t know how to handle that.
This seems possible. Especially since the CPU isn’t spiking.
But then we go back to my original question. What did you expect to happen when you did this?
Okay, I think I understand everything that you’re saying, but I’m not sure where “every iteration takes 1.5ms” is coming from. I had previously stated that it took ~1.5ms to run the 1,000,000 iterations, not that it took 1.5ms to run a single one.
What I expected to happen when I did this was for the initial frame time of ~1.5ms to remain constant over the entire runtime, rather than spiking after ~35 seconds.
Is there anyway to make sure no background process from windows is kicking in during your test? When I was testing Windows 10, I had to wait over 10 minutes for the windows update in the background to finally finish whatever it was doing before I could do my test. I didn’t have to wait in Windows 7 because it’s update support was dropped long ago.