Godot Version
4.2.1
Question
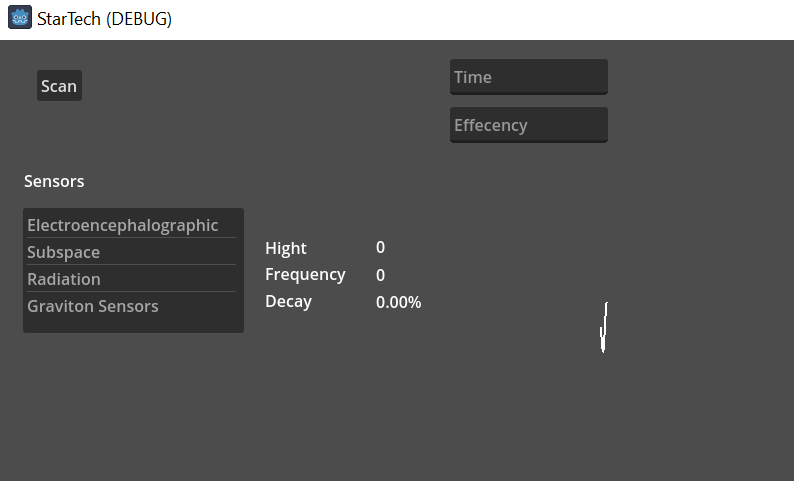
So I am trying to graph a sin wave, however, whenever I run my project the line starts but abruptly cuts off. I have tried increasing the number of points I am using, but it doesn’t seem to affect anything. making the node bigger simply enlarges the whole thing, and does not show more of the line.
Code
extends Line2D


var amplitude = 25
var frequency = .2
var varPoints = 1500

func _draw():
	var step = 2 * 3.141592 / varPoints
	var prev_point = Vector2(0, amplitude * sin(0))

	for i in range(1, varPoints):
		var x = i * step
		var y = amplitude * sin(x * frequency)
		var current_point = Vector2(x, y)

		draw_line(prev_point, current_point, Color(1, 1, 1), 2)

		prev_point = current_point