I’ve heard general wisdom about shader programming like that lots texture reads can be expensive, but it’s been hard to wrap my mind around what I can and cannot get away with without some kind of way of testing the performance of my shaders.
The only information I’ve been able to find on the topic have recommended setting up an empty scene and using Godot’s profiler to measure the total GPU time, and then add an object with a shader to be tested to the scene and measure again. This method is time consuming and can only test shaders one at a time and not in a real-world scenario.
Nvidia Nsight is a program made by the company that likely made your graphics card that can be used to debug the graphics of any game, not just yours! It sounds like it might even work if you don’t have an Nvidia GPU.
I’m going to go over the basics of how to use the program to to test the performance of shaders in your game that you’re worried about, and how to find out that something completely unrelated to what you were worried about is actually the problem.
Please note: I have no clue what I’m doing and am just an imbecile poking and prodding at software beyond my comprehension.
Download and install (Windows)
Download the program here and run the installer.
Whenever you launch the program from either the start menu or the desktop you’ll want to right-click it and select “run as administrator”. Some features are limited if you don’t remember to do this.
Auto launch as admin
To auto-launch Nsight as an administrator:
- Right-click the application in your start menu and select More > Open file location.
- Right-click the shortcut it shows you and click “Properties”.
- Select the “Compatibility” tab in the window that opens.
- Check the box labeled “Run this program as an administrator”.
- Select OK to save your changes and close the window.
To do the same for your desktop shortcut, right-click it and select “Properties” and then proceed from step 3 above.
Attaching to your game
Step 1.
Export your game from the Godot editor by selecting Project > Export… from the top-left and build the game for your platform (Windows in my case). Take note of what folder you put the compiled game in. You’ll need it later.
Step 2.
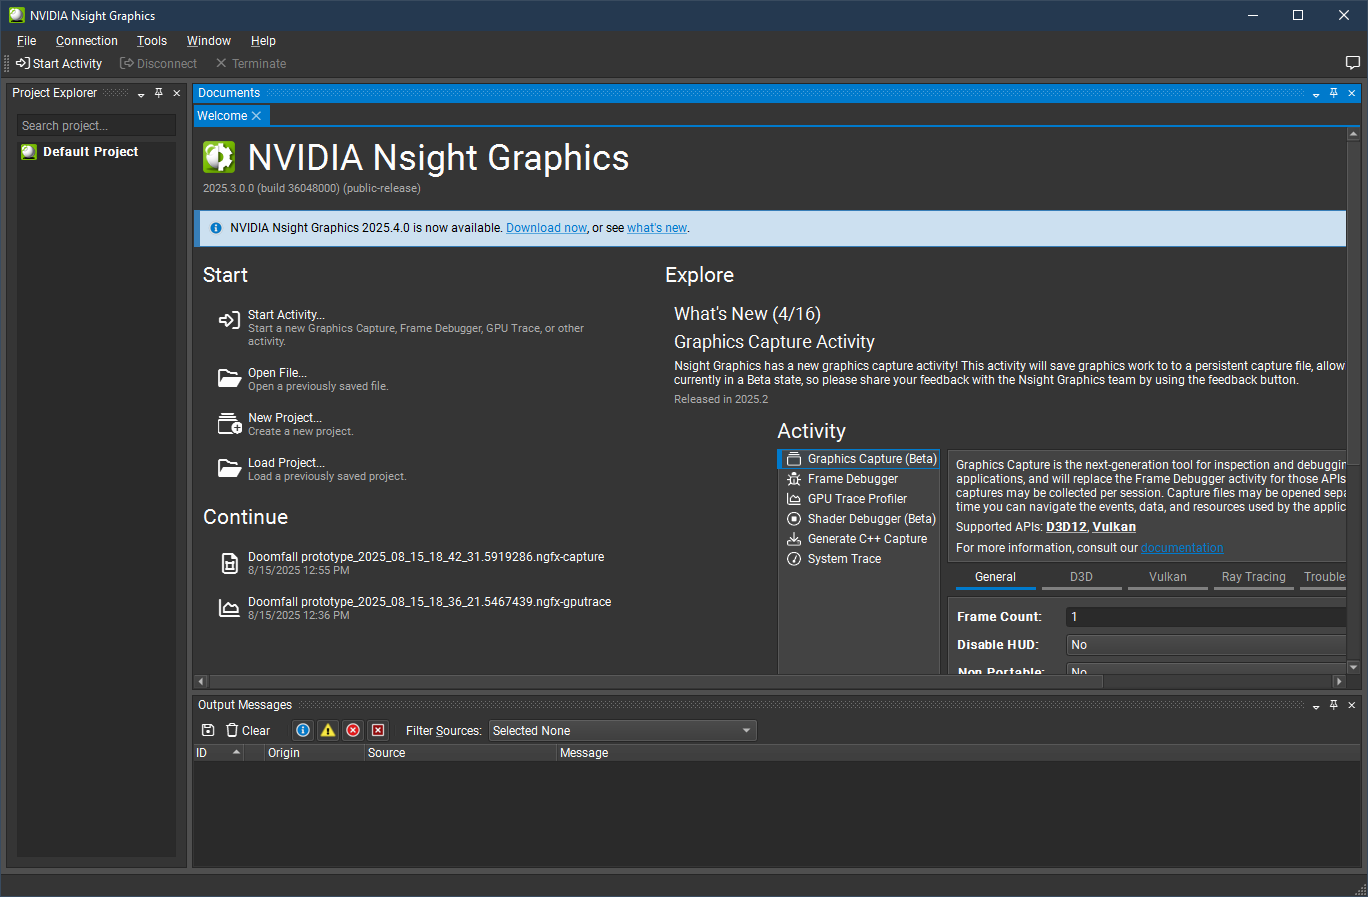
Open Nsight as administrator.
Step 3.
Select “Start Activity” on the ribbon bar at the top.
Step 4.
In the “Target Platform” section of the “Start Activity” window that appears, select the ellipses (…) next to “Application Executable” and navigate to your game’s executable file (game.exe). This will also work with the console (game.console.exe).
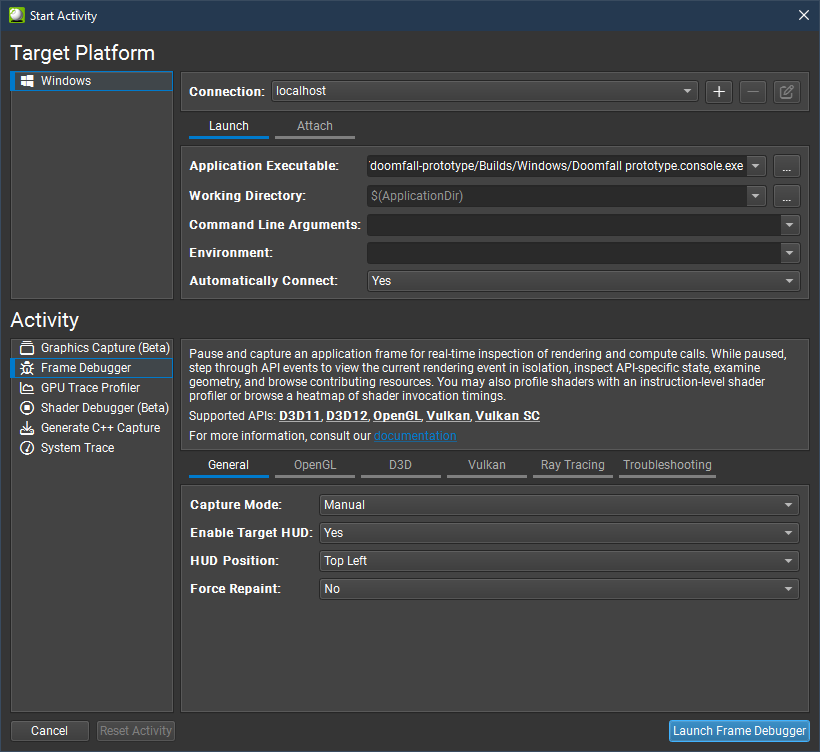
Edit: Add --verbose to the Command Line Arguments: field so Godot will launch with extra debug symbols and things will be properly labeled in Nsight later.
Step 5.
In the “Activity” section, select the “Frame Debugger”, change the HUD position if desired, and then click “Launch Frame Debugger”.
Your game’s executable will now be launched. You may see a popup like this:
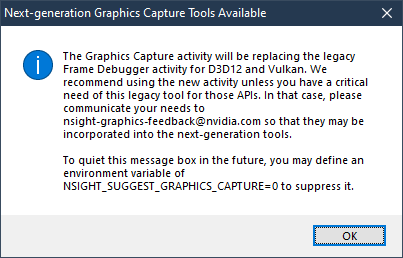
This popup can be ignored. I can’t figure out how to get anything useful out of the “Next-generation” tools.
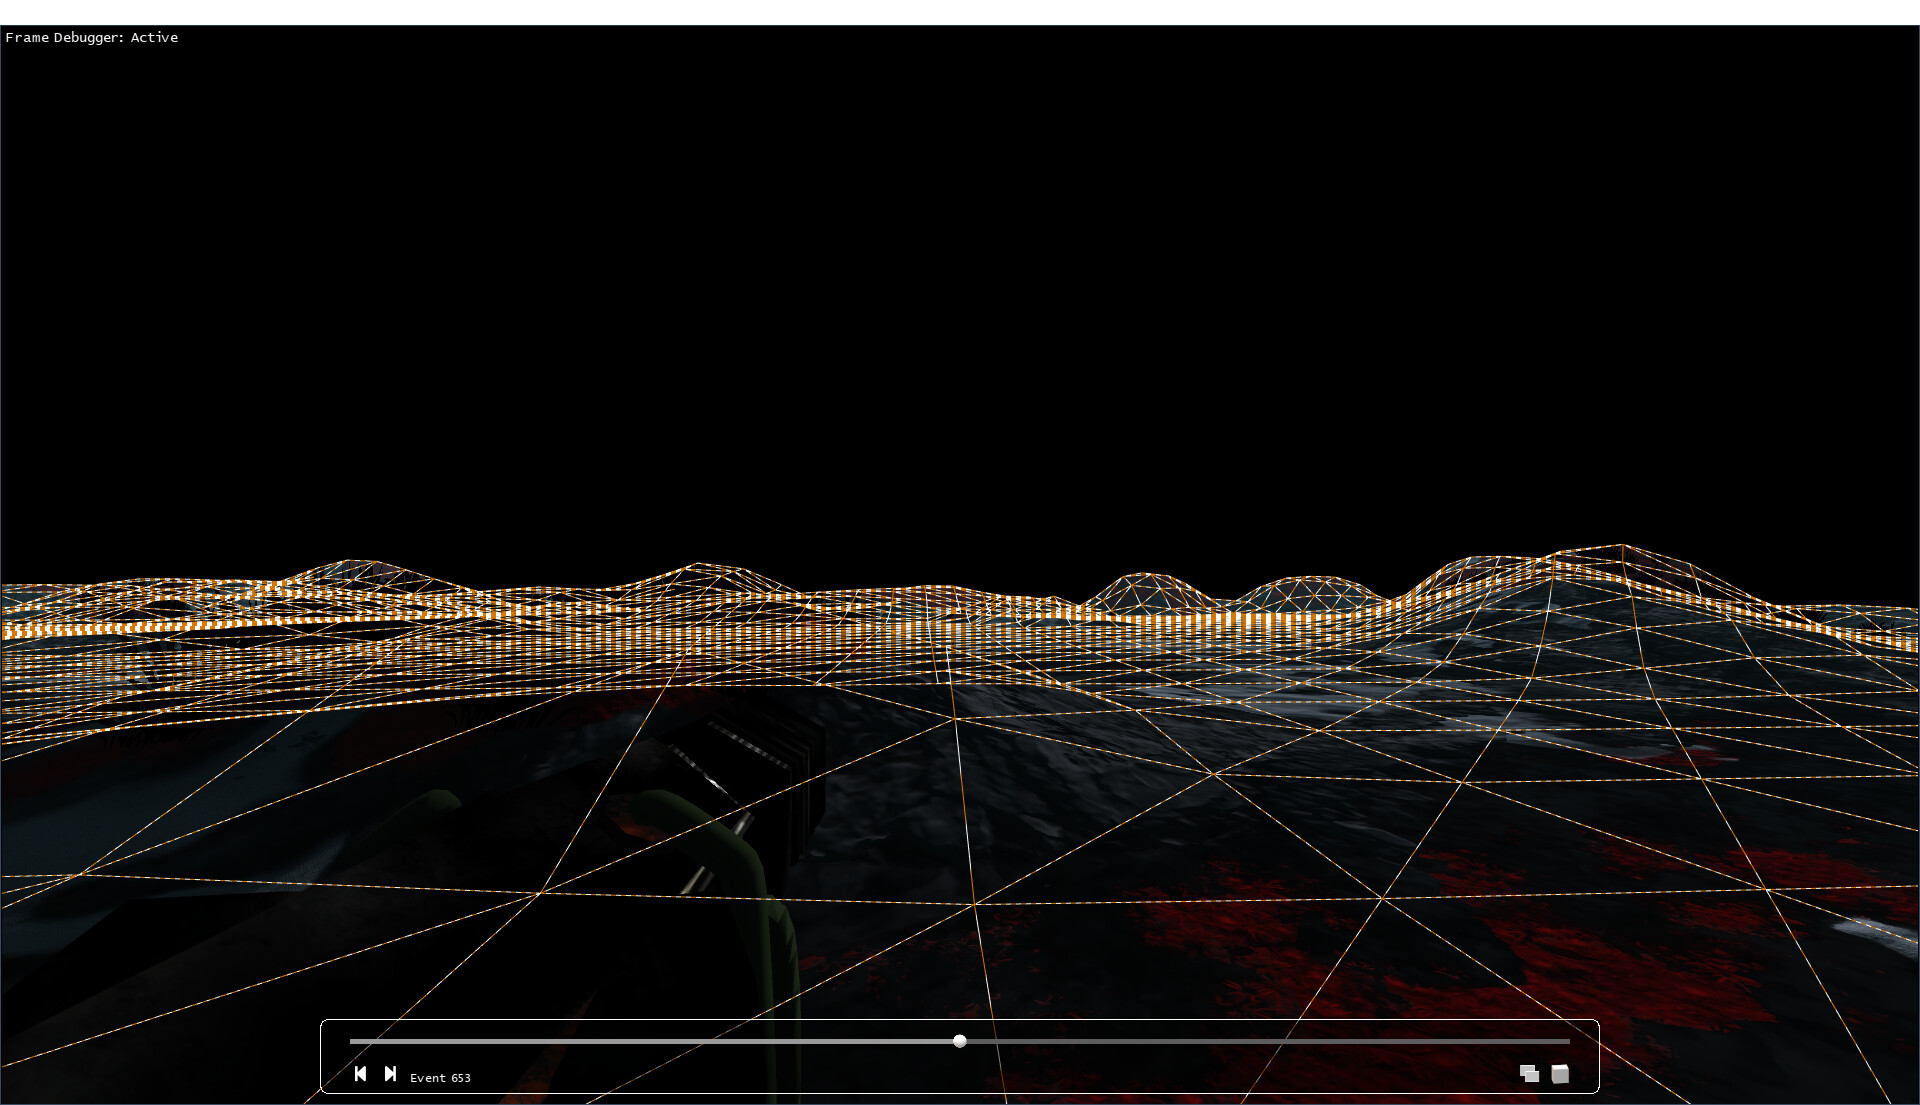
Your game will now run and should have a new HUD element in whichever corner you selected in step 5.
Capturing a frame for analysis
Navigate to a location in your game where you’d be curious to know which elements on screen will take the longest to render and then press F11 to capture a frame for analysis.
What we’re working with now
A new window called “NVIDIA Nsight graphics replay” should open with a screenshot of your game and a some controls visible at the bottom of the screen.
Your game should still be open in another window in the background. We will not be interacting with it anymore but you should not close it.
The Nsight application should now be updated with new information.
Setting up Nsight
In the graphics replay window there will be a couple arrows in the bottom-left that can be clicked to step through the rendering process.
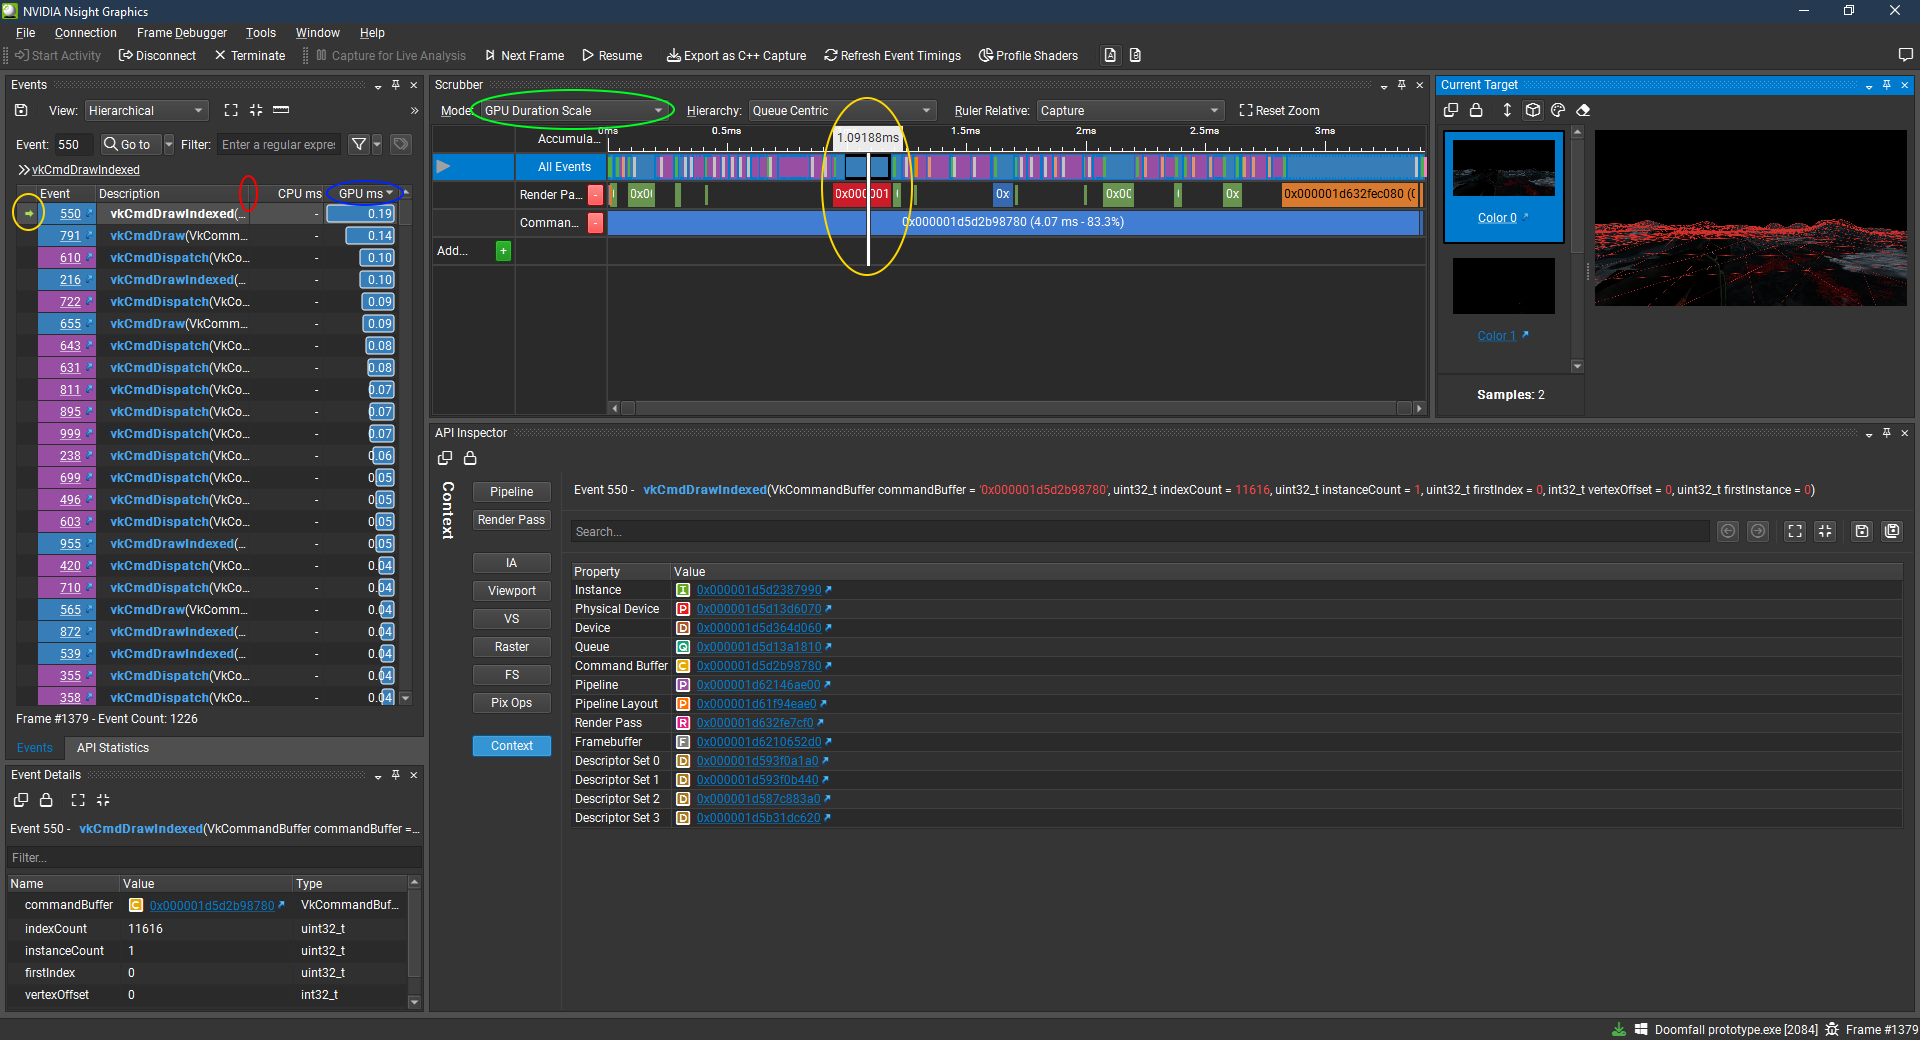
As you click these arrows the Nsight application will update with new information on each step. The arrow in the “events” panel highlighted in a yellow circle in the image below will move to show the selected event as well as the “Scrubber” panel’s cursor as highlighted in the other yellow circle.
I recommend making a few changes to best make use of the program.
- The vertical line between the “description” and “CPU ms” columns of the “events” panel (highlighted in red) should be clicked and dragged to the left to reveal the “GPU ms” column (highlighted in blue).
- The same “GPU ms” column should be clicked a couple times to sort the events by GPU time as depicted.
- The “Mode” dropdown in the “Scrubber” panel (highlighted in green) should be set to “GPU Duration Scale” so the size of each item in the scrubber will reflect how long that even took to render.
- I would also recommend making the “Current Target” panel larger so you can more easily see it’s contents in case you get sick of alt+tabbing to and from the graphics replay window.
What does any of this do and how do I use it?
In the Nsight window the “Events” panel and the “Scrubber” panel both show the same list of events, just in different ways. Each event appears to be a draw call of some kind. Clicking an event in either will select it in the other as well as in the “Current Target” panel and in the graphics replay window. Your selection in everything is synced. The Scrubber can be zoomed in on by holding ctrl and scrolling up or down while your mouse is hovering it.
Events with a higher GPU ms value in the “Events” panel, and that appear wider in the “Scrubber” panel took longer to render. In the screenshot above you can see I have the event that took the longest to render selected and in the “Current Target” panel you can see it’s showing the terrain with a red wireframe rendered over it to highlight the geometry being rendered in that step.
What I recommend doing is clicking each event in the scrubber to see what it is so you can start to get an idea of what is taking the most time.
Please not that objects that are larger on screen will typically take more time to render because there are more pixels to render, and that this is normal.
Example case
In my case; I was worried about the terrain being slow to render, but it only took about 3 times as long to render as the player’s view model (the weapon held in the bottom of the screen when in first-person) despite taking up almost half the screen.
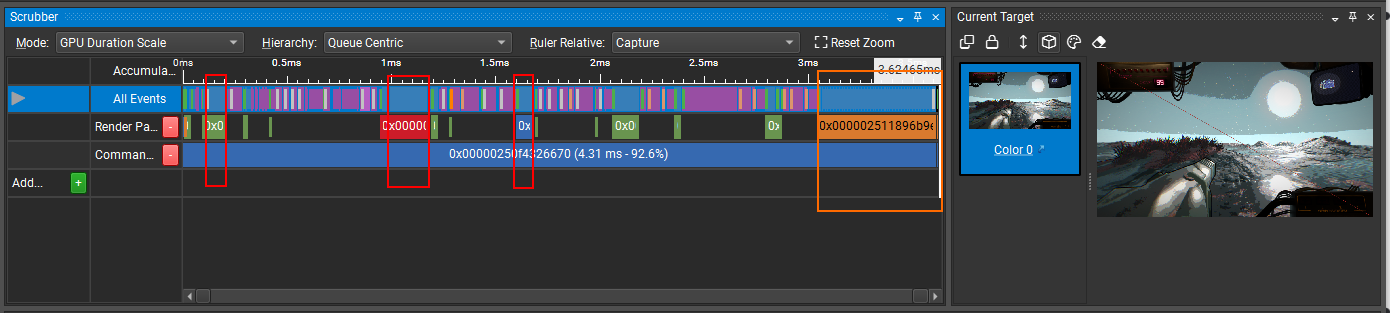
The red boxes in this screenshot highlight what appears to be the rendering of the terrain, meanwhile the orange section highlights the rendering of my 2D HUD.
If we zoom in on the end of the Scrubber’s timeline to get a better look at this expensive cluster of events grouped together by this orange section we can see there is a large number of small events that combined take up a lot of render time.
My in-game HUD is made up of many pre-rendered images that are all layered on top of eachother, and I haven’t optimized this system yet so disabled HUD elements are just transparent, their visible property is still true and they’re still being rendered even if they’re not visible on screen. There are probably 50 of these images in my HUD. Each of these events is one of these HUD elements.
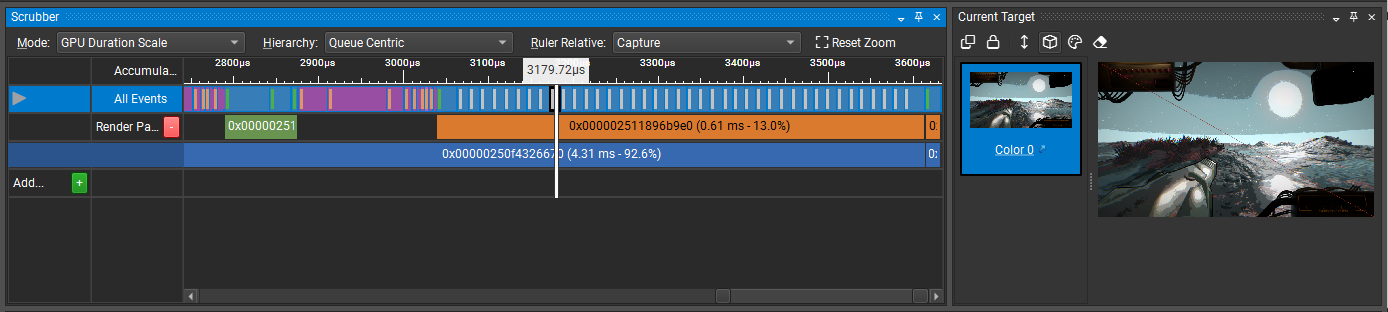
All of them combined take longer to render than the terrain did. If I’m looking to optimize my game, this seems like a better place to focus than on my terrain.
Thoughts
It’s hard to know if a single item taking x ms to render is good or bad so it’s helpful to have other shaders on screen to compare against (like I did comparing the terrain, the 2D HUD, and the view model).
If you’re experiencing slowdown because you have lots of individual items like individual models that are placed repeatedly around your game world each being rendered one at a time, you might want to look into batching by making sure they all use the same shader and material resources. Things like right-clicking a meshInstance3D’s material and selecting “Make Unique” or enabling “Local to Scene” both may break GPU instancing. If you avoid doing these things then you can copy-paste a large number of these objects around your game world and they’ll all just get rendered in a single event/draw call which saves on performance. Using a MultiMesh3D also helps with this.
I hope this is helpful to as least somebody. If you get a better idea of how to use this program than me, I’d love to hear any tips and tricks you come across. I truly have no clue what I’m doing.