Godot Version
4.6.2
Question
Hi! I’m trying to build a mobile game for the first time. It works flawlessly on PC, but it seems to skip code when running on an actual phone. I reasonably believe that console warnings and print() statements can help me debug things and see what’s going on here.
I followed multiple tutorials on the official Godot pages, tried USB and WiFi debugging, and nothing I did made it possible for the console to work when debugging the app. The Debug/Deploy with Remote Debug setting is on, the game exports rather decently (minus the aforementioned bugs), and runs rather smoothly on my phone, it even streams the screen correctly to my PC with one-click debug, but it doesn’t show any signs of the console working.
I found this forum post that has the same issue, but that seems to be a version issue with 3.2 betas, while I’m 4.6.2. Didn’t seem to help. This forum comment helped me get the WiFi debug going, but that didn’t change anything compared to USB debugging, except that the USB connection seemed to end abruptly, and WiFi doesn’t.
I’ve seen something about debug symbols, but isn’t that for a google play console, and not the Godot native console? Is that what’s required for my case?
Am I missing something, or does it just not work like that?
Hi! Do you keep the USB plugged in? What phone are you using? Do any errors popup?
In the Godot editor console, something like this would show up:
Installing to device (please wait...): Poco 2412DPC0AG
--- Debugging over USB ---
--- DEBUGGING OVER USB ---
Reverse result: 0
Godot Engine v4.6.1.stable.official.14d19694e - https://godotengine.org
Vulkan 1.3.278 - Forward Mobile - Using Device #0: ARM - Mali-G720 MC7
Followed by the program output (like print()).
Do not run the project on the PC, as that would override the console output.
Make sure you have got Android SDK Command Line Platform Tools like ADB installed, if not, here: https://developer.android.com/tools/releases/platform-tools
Sorry for the delay. This is the console output on running on my phone. I get no errors on export (or at least none that I can see).
0 param: --remote-debug
1 param: tcp://localhost:6007
2 param: --debug-collisions
3 param: --xr_mode_regular
4 param: --xr-mode
5 param: off
6 param: --background_color
7 param: #000000
8 param: --debug_opengl
Uninstalling previous version: Motorola moto g86 5G
Installing to device (please wait...): Motorola moto g86 5G
--- Wi-Fi remote debug enabled in project settings; debugging over Wi-Fi ---
--- WI-FI REMOTE DEBUG ENABLED IN PROJECT SETTINGS; DEBUGGING OVER WI-FI ---
I have everything up and running, it exports in debug mode seemingly flawlessly. It shows the remote debug seems to work as it should, but those are the last lines I get, it never gets to the Reverse result: 0 line, even over USB (I switched over to wifi to see if anything changed, it didn’t) (it does the one reverse result line on USB, but stops there), let alone any print() statements. I didn’t disconnect the USB ever, while debugging over it, but it did seem to disconnect on its own, so another reason to swap to wifi.
I configured everything seemingly correctly. Note that I’m running Linux instead of Windows.
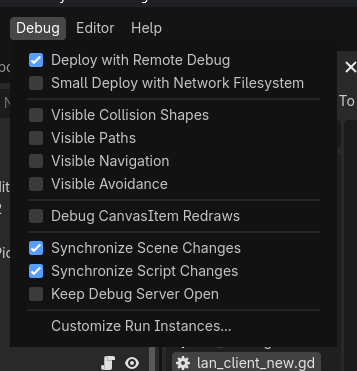
I would check if these options are enabled:
Try reinstalling the Platform Tools using the URL I provided, not a package manager, since a broken adb installation (and the dependencies) could be the problem.
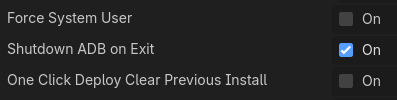
In Editor Settings>Export>Android (with Advanced Settings turned on) these options work for me:
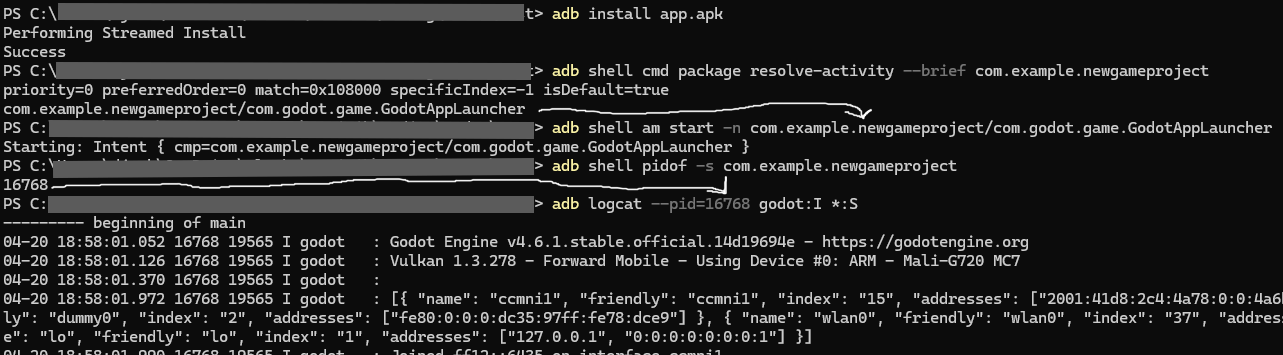
Try these series of commands to check if your system even has access to the stdout, as this can narrow down the problem: (I am using Windows, but these commands should work on Linux)
Don’t forget to replace all the values such as com.example.newgameproject with your own.
Did that and it executed everything as expected.
Turns out, it’s Rapier2D that was messing up my project (is it compatible with mobile?), but the problem still persists.
I can see the log output by running logcat, but it still won’t show up in my godot console…
I noticed this on the terminal output through logcat:
--------- beginning of main
04-20 17:33:52.842 28232 28232 E godot   : ERROR: Remote Debugger: Unable to connect. Status: 3.
04-20 17:33:52.842 28232 28232 E godot   :    at: _try_connect (core/debugger/remote_debugger_peer.cpp:175)
04-20 17:33:52.842 28232 28232 E godot   : ERROR: Condition "_try_connect(stream)" is true. Returning: nullptr
04-20 17:33:52.842 28232 28232 E godot   :    at: create_tcp (core/debugger/remote_debugger_peer.cpp:233)
04-20 17:33:52.931 28232 28269 I godot   : Godot Engine v4.6.2.stable.official.71f334935 - https://godotengine.org
04-20 17:33:53.008 28232 28269 I godot   : Vulkan 1.3.247 - Forward Mobile - Using Device #0: ARM - Mali-G615 MC2
Does that help?
Code 3 is the STATUS_ERROR code of StreamPeerTCP, which means that there was an error connecting to the device.
This function is failing: (this is C++, but its pretty similar to C#/GDScript)
Error RemoteDebuggerPeerTCP::_try_connect(Ref<StreamPeerSocket> tcp_client) {
	const int tries = 6;
	const int waits[tries] = { 1, 10, 100, 1000, 1000, 1000 };

	for (int i = 0; i < tries; i++) {
		tcp_client->poll();
		if (tcp_client->get_status() == StreamPeerTCP::STATUS_CONNECTED) {
			print_verbose("Remote Debugger: Connected!");
			break;
		} else {
			const int ms = waits[i];
			OS::get_singleton()->delay_usec(ms * 1000);
			print_verbose("Remote Debugger: Connection failed with status: '" + String::num_int64(tcp_client->get_status()) + "', retrying in " + String::num_int64(ms) + " msec.");
		}
	}

	if (tcp_client->get_status() != StreamPeerTCP::STATUS_CONNECTED) {
		ERR_PRINT(vformat("Remote Debugger: Unable to connect. Status: %s.", String::num_int64(tcp_client->get_status())));
		return FAILED;
	}
	return OK;
}
Which is called by
Ref<RemoteDebuggerPeer> RemoteDebuggerPeerTCP::create_tcp(const String &p_uri) {
	ERR_FAIL_COND_V(!p_uri.begins_with("tcp://"), nullptr);

	String debug_host = p_uri.replace("tcp://", "");
	uint16_t debug_port = 6007;

	if (debug_host.contains_char(':')) {
		int sep_pos = debug_host.rfind_char(':');
		debug_port = debug_host.substr(sep_pos + 1).to_int();
		debug_host = debug_host.substr(0, sep_pos);
	}

	IPAddress ip;
	if (debug_host.is_valid_ip_address()) {
		ip = debug_host;
	} else {
		ip = IP::get_singleton()->resolve_hostname(debug_host);
	}

	Ref<StreamPeerTCP> stream;
	stream.instantiate();
	ERR_FAIL_COND_V_MSG(stream->connect_to_host(ip, debug_port) != OK, nullptr, vformat("Remote Debugger: Unable to connect to host '%s:%d'.", debug_host, debug_port));
	ERR_FAIL_COND_V(_try_connect(stream), nullptr);
	return memnew(RemoteDebuggerPeerTCP(stream));
}
The StreamPeerTCP is failing to connect, which is weird.
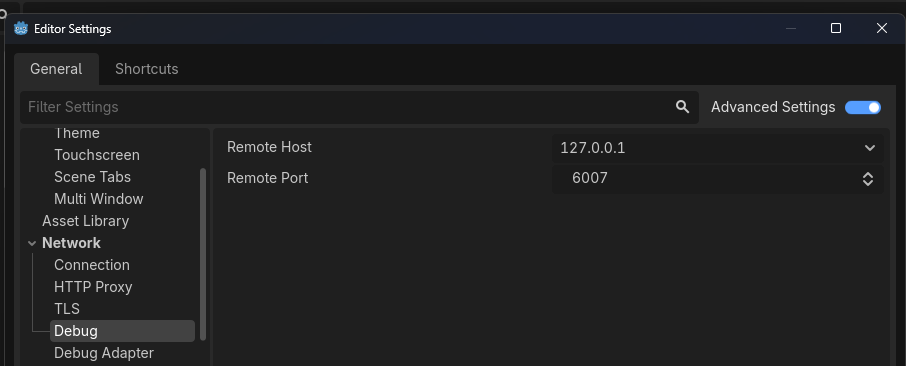
The ports seems to be hard-coded, so did you change the port perhaps?
Or have you got any firewall rules? (I don’t know how to change that on Linux)
If not, I am simply unable to find the issue, as the only thing that can be causing it is some IP shenanigans
Firewall works over USB? I can understand it blocking the wifi debug, but USB?
I can’t seem to find adb or godot on the firewall settings, how do I allow android debug over whatever channel?
No, USB not, but on Wi-Fi. But this is just a wild guess. If it doesn’t work over USB, then it probably is a diffrent issue.
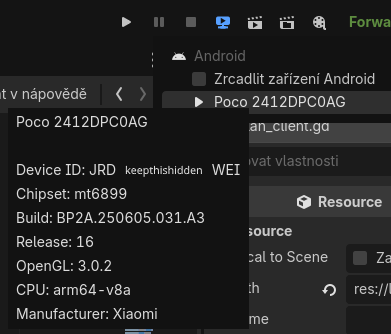
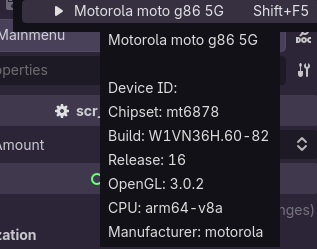
If you have any hope left, could you send the information about your device when you hover over it in the editor?
Example:
Forgor to edit out the device ID 
I swapped back to USB, and still nothing,
Weird that collision shapes are shown, but not paths, because I configured both to show on the mobile screen.
I mean to me it seems like an issue with Godot or your desktop OS, as your Android device is up-to-date. I would talk to a person that knows Godot inside out, since it could be possibly anything.